
The following is a list of all the programs available on this site. All programs work on TradeStation 9.5 and TradeStation version 10. If you would like more information, click on a title.
If you are just interested in strategies, I have created a page that lists them here.
Click here for MultiCharts compatible programs.
Program 1 | Fibonacci-confluence show-me study
Click here to see more detail.
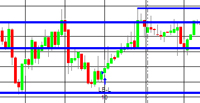
The program works with versions 8.7 and above, including TradeStation version 10. This program works by creating zig-zag lines (based on low and high pivots). Every time a zig-zag line is confirmed Fibonacci levels are calculated. These Fibonacci levels are compared with previous Fibonacci levels and if they are proximate the level stored in the array has its ‘thickness’ increased by one. The thickness attribute is used to indicate the significance of the level. More significant levels are drawn on the chart using a thicker line and only lines above a user input thickness are extended to the right.
Click here to see more detail and to download program 1
Program 2 | Pivot lines-confluence show-me study
The program works with versions 8.7 and above, including TradeStation version 10.
Click here to see more detail.
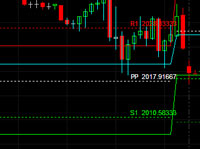
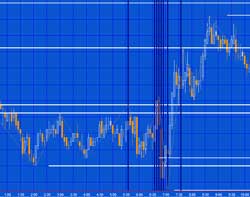
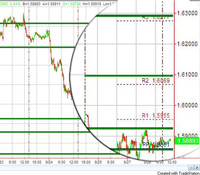 Program 2 calculates these pivot levels (using the classic method of calculation, the ‘Woodie’ levels, or the ‘Camarilla’ levels) it then seeks to find pivot levels that are close to those found previously on the chart (within a specified user input tolerance) and draws these levels on the chart.
The rationale behind the program is that if pivot levels have had real significance on a previous day then some of that influence could still be felt on the current day.
The image on the right shows the pivot based levels as green lines and today’s pivots as different colored lines with labels showing the type of pivot line (e.g. PP, R1, R2, S1, S2 etc) and its value. I created a ‘zoomed in ‘ effect in Photoshop so you can see these lines more clearly.
Click here to see more detail and to download program 2
Program 3 | Three line break show-me study
Click here to see more detail.
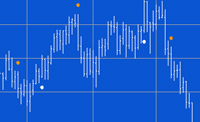
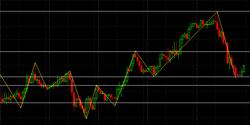
This program takes the work done in tutorial 23 and converts it to a show me study. The functionality to draw the ‘quasi’ 3 line break boxes has been removed from the tutorial 23 program and showme dots are drawn at the start of, what would have been the green boxes and what would have been the red boxes on the tutorial 23 indicator.
Click here to see more detail.
Program 4 | Three line break pivot confluence
 Click here for more detailed information about program 4.
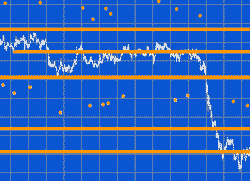
This program looks for turning points as they occur on a line break chart. Each newly discovered level is compared with levels already stored in an array. If the new level is close enough to an existing level, the two levels are combined. The number of times that each line is combined is also stored in the array. If the new level is not close to an existing level the new level is stored in the array.
The program works with versions 8.7 and above, including TradeStation version 10.
Click here for more detailed information about program 4.
Program 5 | Line break strategy
 Click here for more details about program 5.
Program 5 takes the principles used in tutorial 23 and program 3 and builds them into a strategy. Instead of drawing a dot on the chart, as the ShowMe study does, the strategy issues a market order on the next bar after a new line break ‘line’ begins. The strategy includes several ‘template’ filters so that you can easily build filters into the program.
The program was developed in TradeStation 8.7 (and so is compatible with versions 8.7 and above, including 10).
Program 6 | Pivot confluence strategy
Click here for more details about program 6
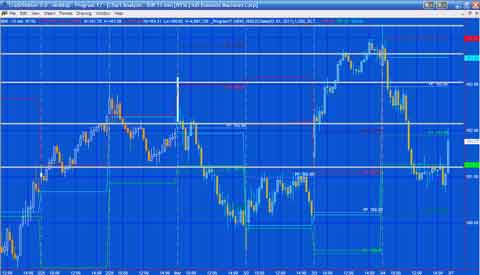
 Program 6 builds upon the work done in tutorial 13 to search for price pivots that may carry special significance. Having found such a pivot level of a certain ‘weighting,’ this program then enters trades based on a user defined filter and the number of ‘weighted’ pivots above and below the newly found pivot.
The program was developed in TradeStation 8.7 (and so is compatible with versions 8.7 and above, including 10).
Program 7 | Configurable traders’ Pivots Indicator
Click here for more details about the traders’ pivot indicator (program 7)
 Program 7 provides a flexible way to define a session based on user input start and end times and calculates and adds to the chart Classic, Woodie, or Camarilla traders’ pivots based on the high, low, and close of the period defined by the user (and the open of the next period in the case of Woodie pivots). The type of pivot drawn on the chart depends on which type of pivot is selected by the user.
The start and end times can be on the same day, or the start can be on one day and the end on the next day. Plots of the high, low and close of the period being analyzed may be switched on or off using a user input.
The program was developed in TradeStation 8.7 (and so is compatible with versions 8.7 and above, including 10) and works with intraday and tick charts.
Click here for more information about the traders’ pivot indicator (program 7)
Program 8 | Zig zag conflux
Click here to get more information about program 8 – Zig Zag Confluence
 This show-me study builds on the work done in tutorial 13 and program 1. It is designed to be an efficient way of calculating a user-specified number of potential support and resistance levels based on zig zag pivots found on the chart.
The program was developed in TradeStation 8.7 (and so is compatible with versions 8.7 and above, including 10) and works on intraday, daily, weekly, and monthly charts.
Program 9 | Smoothed and low-lag CCI indicator
Click here to get more information about program 9
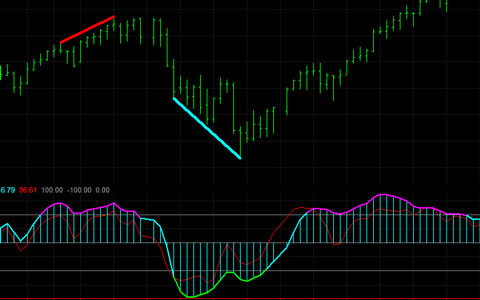
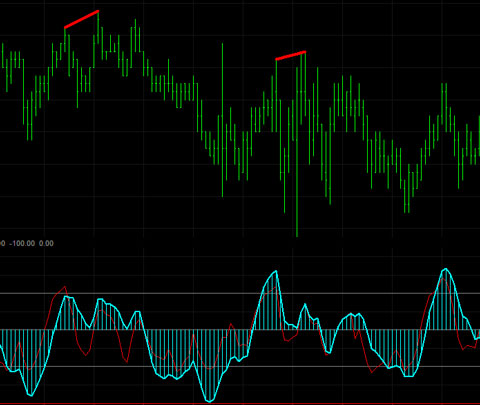 This PROTECTED indicator is a smoothed, low-lag Commodity Channel Index (CCI) TradeStation EasyLanguage indicator. It also provides the option to look for divergences between price action and the smoothed CCI (see image on right.)
The program was developed in TradeStation 8.7 (and so is compatible with versions 8.7 and above, including 10) and works on intraday, daily, weekly, and monthly charts.
Program 10 | Smoothed and low-lag CCI indicator (enhanced)
Click here to get more information about program 10
 Program 10 takes program 9 and adds the following enhancements:
- Allows user inputs for the color of the CCI line when above the UpperLine input (in this case, it is set to 100), or below the LowerLine input (in this case it is set to -100) and between the lines.
- Sets an alert when the UpperLine and LowerLine lines are crossed.
- In additional to the divergence functionality included in Program 9, program 10 looks for divergence between the two most recent smoothed CCI pivots, and the most recent price pivot and the pivot before the second most recent price pivot. I explain this is the video below.
Program 11 | An enhanced smoothed, low-lag Commodity Channel Index (CCI) indicator – WITH ADDITIONAL FEATURES
Click here to get more information about program 11
Program 11 takes programs 9 and 10 and adds additional enhancements as follows:
- A new input that allows users to look for divergences between price and the smoothed fast CCI
- A new user input allows the user the option of drawing a line when there is a possible divergence. The line would then disappear if the divergence. were not confirmed when the bar closes.
- A new input allows user the ability to look for potential divergences faster.
Click here for more explanation of these new features.
Bonus TradeStation Scanner video
If you buy the TradeStation version, I will also send you a link to a video that explains how you could use this program to scan a universe of stocks to see which ones the indicator has found possible divergence for using TradeStation Scanner.
Program 12 | Candlestick pattern strategy with user defined filters
 Click here for more information about Program 12
Program 12 looks for CandleStick patterns to create possible trade signals. These signals are filtered by user defined filters before possible trades are entered.
The following candlestick patterns are searched for (selected by user input): Three Black Crows, Bearish Harami, Bearish Engulfing, Hanging Man, Evening Doji Star, Evening Star, Dark cloud, Three White Soldiers, Bullish Harami, Bullish Engulfing, Hammer, Morning Doji Star, Morning Star, and Piercing Line.
Program 13 | ‘Pivot-Limit’ strategy
Click here for more information on program 13
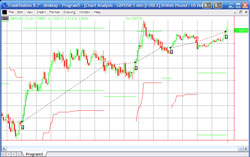
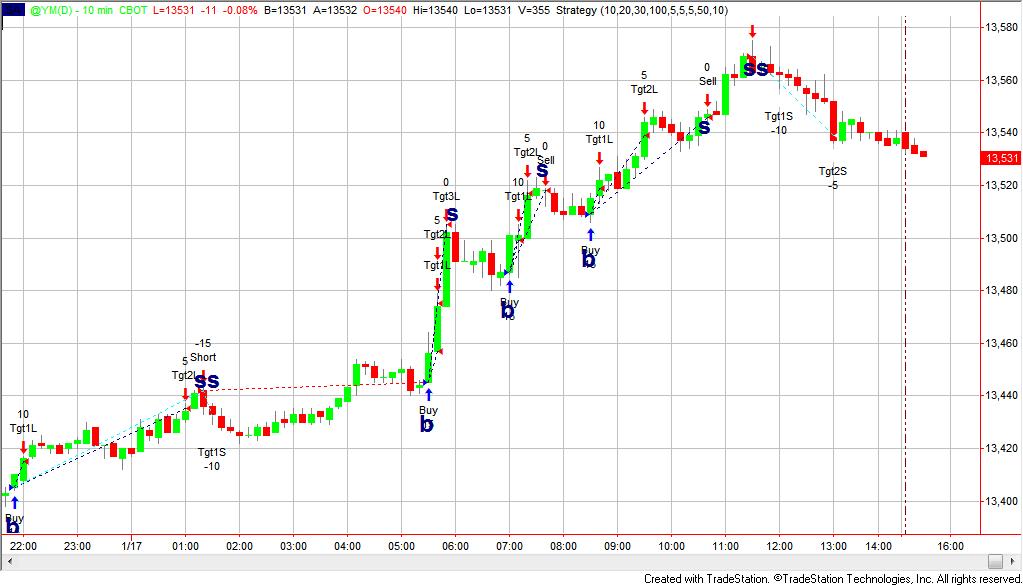
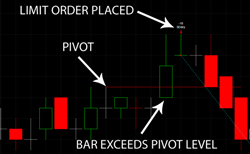 Program 13 is a TradeStation EasyLanguage strategy which works in versions up to 10, that looks for a pivot formation followed by a retracement before placing a limit order at the pivot price level. The strategy also allows the user to setup filters in order to easily customize the program. The image illustrates a short setup (the annotations were added in Photoshop).
In the ‘short’ setup we look for a high pivot, for the price to dip down, then rise above the pivot level for a limit order to be placed next bar (you can also define filters to further restrict when a trade is placed.) The long setup requires a low pivot, followed by a lower low for a long limit order to be placed next bar (again, you can define filters to further restrict when trades are placed).
Program 14 | Finding the times where price changes direction most often
 Click here to read more information and see a video explaining program 14.
Program 14 analyzes an intraday chart to see if, over the time being analyzed, there are specific times when price action most frequently changes direction.
Program 14 is an EasyLanguage show me study developed in TradeStation version 9.0 (and so is compatible with versions 9.0, 9.1 and higher). It calculates zig zag patterns and stores the times at which the turning points occur in an array. Each time a new turning point is confirmed the time at which it occurred is compared with those already in the array. If the time is already in the array its ‘significance index’ is incremented by one.
Program 15 | Finding potential turning ‘zones’
Read more about program 15 here
Program 15 analyzes price action in terms of both time and potential support and resistance levels on intraday charts to try and find ‘zones’ where, historically, price turning points have occurred.
 The ShowMe study works by pin-pointing significant turning points. It then analyzes both the times and price levels at which these significant turning points occur most often, keeping a record of these times and levels. Moving forward through the chart, the program analyzes each bar and if it occurs at a time and between two price levels that have been recorded, it draws a line segment, or “zone,” on the chart.
Program 16 | Support and resistance levels combined with time zones
Read more about program 16 here
 Program 16 is an unprotected TradeStation EasyLanguage show me study which analyzes price action in terms of both time and potential support and resistance levels on intraday charts to attempt to find ‘zones’ where, historically, significant price turning points have occurred. The idea behind the program is that if turning points occur at specific times or levels previously, then, perhaps, they will occur at these times and/or levels again.
Program 17 | Finding a conflux of traders’ pivots
More information, including a demonstration video, can be found about program 17, here.
 Program 17 is an unprotected TradeStation EasyLanguage Indicator which calculates traders pivots (PP, R1, R2, S1 and S2 levels) using either classic, Woodie, or camarilla formulae based on user defined session times. The program calculates traders’ pivot levels for the entire chart and then analyzes the data to find potential levels where there is a conflux of traders’ pivot levels (in other words, where several levels have occurred in approximately the same price level).
Program 18 | CCI divergence strategy (and smoothed CCI indicator)

Program 18 consists of an unprotected TradeStation EasyLanguage strategy together with a protected EasyLanguage function and a smoothed CCI indicator. The function calculates the smoothed Markplex CCI (using the calculation previously applied in programs 10 and 11) and it is called from both the strategy and the indicator. The strategy bases signals on divergence between the smoothed CCI and price.
UPDATE: The download now includes MultiCharts export files. As with the TradeStation version, the CCI function is protected. The download includes the following files: PROGRAM18.ELD, _Program18.pla and_Program18-function.sef. If you are a TradeStation user will just need to install PROGRAM18.ELD. If you are a MultiCharts user you will need to install _Program18.pla and_Program18-function.sef. Install _Program18-function.sef BEFORE _Program18.pla.
The program works in TradeStation versions 8.7, 8.8, 9.0, 9.5 and 10.0. I have commented the code. It has been tested it on intraday, daily, weekly and monthly charts for futures, stocks and forex.
Program 19 | Indicator to draw rectangle with alerts triggered when price crosses sides
 Program 19 consists of an unprotected TradeStation EasyLanguage indicator for TradeStation version 9.0 and 10. It draws a rectangle on the chart that the user can move by clicking on one of the sides and moving it. The other sides then adjust to join the new position of the line just moved. The program includes alerts to the top line, bottom line and right line, so that if the price of the last bar on the chart crosses any of these lines an alert occurs.
This program is available for immediate download for $95- by clicking the ‘add to cart’ button below. You may pay using PayPal or a credit card.
Program 20 | CCI trend break strategy
For more information on program 20 click here.
 Program 20 consists of an unprotected TradeStation EasyLanguage strategy that generates trades based on the crossing of CCI ‘trend’ lines. Trend lines are calculated by joining CCI pivot points and then continuing the imaginary line until crossed by the CCI. In addition long trades are only instigated when the CCI is below a value specified in the user input CCILowFilter and short trades are only instigated when the CCI value is greater than a value specified in the user input CCIHighFilter. The program also includes some filters that can be easily modified by the user.
This program is available for immediate download for $195- by clicking the ‘add to cart’ button below. You may pay using PayPal or a credit card.
A MultiCharts version of the strategy is also available for $165-. This does not include the bonuses (i.e. tutorial 63 and the bonus video).
Program 21 | Turning points show-me study
For more information on program 21 click here
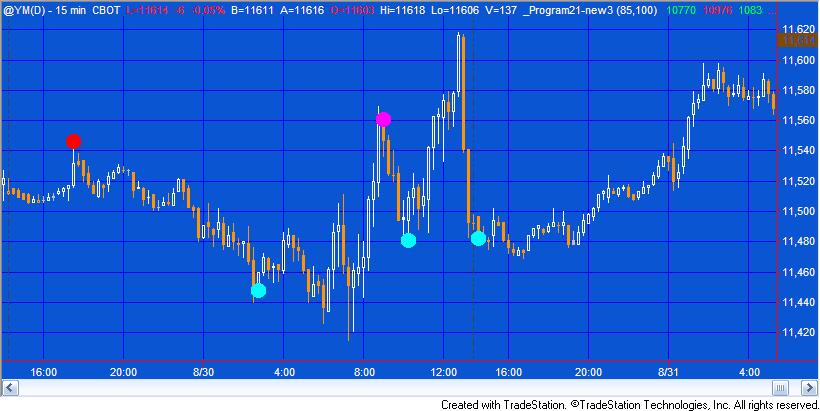 Program 21 | Turning Point Finder is a TradeStation EasyLanguage ShowMe study designed to find turning points in price action on a chart. The program works by searching for four distinct chart conditions based on a proprietary combination of the Commodity Channel Index (CCI), stochastics and price momentum. ‘Points’ are drawn on the chart at the specific bar where the conditions become true. Should the condition cease to be true during the formation of a bar, then the ‘point’ is removed. Points are NOT drawn historically (i.e. the program doesn’t recognize a pivot and then plot it retroactively, hence looking good on a chart but having little practical use).
Program 22 | Configurable three line break indicator
 For more information on program 22 click here
Program 22 | Configurable Three Line Break Indicator, adds to tutorial 23 by the introduction of an input which, if set to TRUE, resets the line break every day. I explain more in the video below. I have also added the following additional capabilities:
- An input which when set to true, turns off the ‘lines’ or boxes.
- An input to control the thickness of the lines (or boxes).
- An input to determine how many lines to include in the ‘break.’ The default being three (this one was already included in tutorial 23)
In addition, the ‘lines’ are represented by rectangles, as opposed to the segmented rectangles that were used in the earlier program.
Program 23 | Adaptive moving average
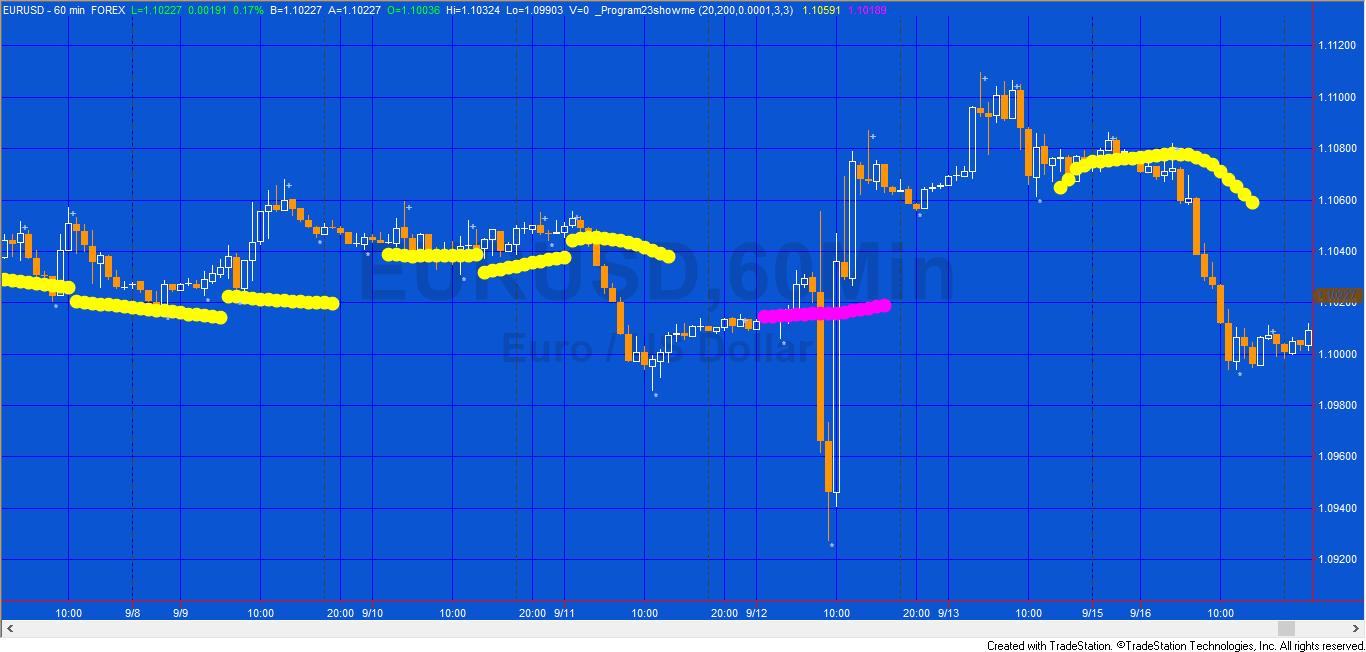 This TradeStation EasyLanguage showme study seeks to find these moving averages and then it ‘adapts’ its moving average length according to the length of the moving average that was close to the previous high or low pivot.
The program works by, at every new high or low pivot, calculating a range of moving averages (depending on the user inputs). It then compares these moving average values (starting with the slowest, i.e. the moving average with the longest length) and if it finds one within a user defined tolerance of the pivot, it begins plotting a moving average with that length.
Program 24 | Finding ‘reverse’ or ‘hidden’ divergence between price and a smoothed CCI
 Program 24 looks for ‘hidden’ or ‘reverse’ divergence between price and a smoothed CCI. Program 24 also has:
- An input that allows users to look for hidden divergences between price and the smoothed fast CCI
- A user input allows the user the option of drawing a line when there is a possible hidden divergence. The line disappears if the hidden divergence. were not confirmed when the bar closes.
- An input that means the program looks for potential hidden divergences consisting of two CCI pivots, an initial price pivot and then a price occurring on the same bar as the second CCI pivot that indicates a possible divergence. The second price ‘sampling’ does not necessarily need to be a price pivot. The idea is that it could possibly give the user early warning of a divergence, prior to the price pivot occurring
The program was developed in TradeStation 9.0 (and so is compatible with versions 9.0, 9.1 and higher) and works on intraday, daily, weekly, and monthly charts.
Program 25 | Candlestick finder
Click here for a full program description.

Program 25 is a show me study that searches for candlestick patterns on both charts and RadarScreen. You can determine whether to search for particular patterns by setting a user input. The program works in RadarScreen, where you have the option of seeing if a patterns has occurred on the current ‘bar’ or whether one has appeared within a user input number of bars. The program includes an optional Stochastic filter and you can also set Alerts. It includes a commentary capability in RadarScreen.
The programs were developed in TradeStation 9.0 (and so is compatible with versions 9.0, 9.1 and higher) and work on intraday, daily, weekly, and monthly charts.
Program 25 (with plots) ADVANCED | NEW version of program 25

Click here for more information about Program 25 (with plots) ADVANCED
Program 25 (with plots) is a new version of program 25 with the following features:
- A user input determines whether the candlestick patterns are indicated by text (as in the original program 25) or show-me dots
- The upper and lower limits for the stochastic filter are now user inputs
- A new %R filter has been added together with user input upper and lower limits
- The stochastic and %R filters may be used independently or together
For a full description of all the candlestick patterns this program looks for, as well as information about using it with RadarScreen see the original program 25 information.
In addition, the download for program 25 (with plots) includes two bonus videos:
- Video one explains how I modified the hard coded upper and lower stochastic limits into user inputs
- Video two shows how I added the new %R filter to the program
Hopefully you will be able to apply these techniques to other programs.
Program 25 (with plots) ADVANCED MultiCharts compatible version
 Program 25 (with plots) ADVANCED MultiCharts compatible version is a new version of program 25 that has been modified to work with Multicharts 8 with charts and the Market Scanner. It also is fully functional with TradeStation 9.0 and above. The program has the following features:
- A user input determines whether the candlestick patterns are indicated by text (as in the original program 25) or show-me dots
- The upper and lower limits for the stochastic filter are now user inputs
- A new %R filter has been added together with user input upper and lower limits
- The stochastic and %R filters may be used independently or together
- Inputs have been created to enable users to change the background colors for cells in RadarScreen or Market Scanner (see the inputs below)
Program 26 | Zig zag repeated change

Program 26 is a TradeStation showme study created in TradeStation 9.0 (and so is compatible with versions 9.0, 9.1, 9.5, 10.0 and higher. It is also compatible with MultiCharts) that calculates zig-zag patterns and calculates the difference between each high and the next low, and the difference between each low and the next high. The values are ‘drawn’ on the chart to the appropriate number of decimal places. In addition, the program compares each downward zig zag with the previous downward zig zag. If the new downward zig zag is with a user defined tolerance of the previous downward zig zag, the thickness of the current downward zig zag is increased to a user defined value. Similarly, if the new upward zig zag is with a user defined tolerance of the previous upward zig zag, the thickness of the current upward zig zag is increased to a user defined value.
The programs were developed in TradeStation 9.0 (and so is compatible with versions 9.0, 9.1 and higher) and work on intraday, daily, weekly, and monthly charts. The show me study may be applied to tick charts, but the pattern text may not display correctly due to an EasyLanguage drawing tool limitations.
If you are a Gold Pass member make sure you enter the special coupon code to get 20% discount off these prices.
Program 27 | MACD divergence for charts, scanner and RadarScreen
Program 27 is a TradeStation indicator that looks for regular divergence between price and a MACD indicator. Inputs allow the user to determine whether to use MACD, exponential average of MACD or the difference between the two. The program works by finding and storing price and the MACD pivots in an array. The pivots must occur within a user defined number of bars of each other. Once a new pivot pair is found is is compared with a user defined number of pivots (maximum 4 previous pivots) to check if positive or regular divergence has occurred. The program works on charts, RadarScreen and the TradeStation scanner.
Get more information about program 27 here.
The program was developed in TradeStation 9.0 (and so is compatible with versions 9.0, 9.1 and higher) and work on intraday, daily, weekly, and monthly charts. The show me study may be applied to tick charts, but the pattern text may not display correctly due to an EasyLanguage drawing tool limitations.
If you are a Gold Pass member make sure you enter the special coupon code to get 20% discount off these prices.
Program 28 | Stochastic divergence for charts, scanner and Radarscreen

Program 28 is a TradeStation Indicator developed using EasyLanguage designed to look for potential divergences between price and a stochastic oscillator.
The program works on charts, RadarScreen and the TradeStation scanner. It was developed using TradeStation 9.0 (and so is compatible with versions 9.0, 9.1, 9.5, 10.0 and above).
See more information about program 28 here.
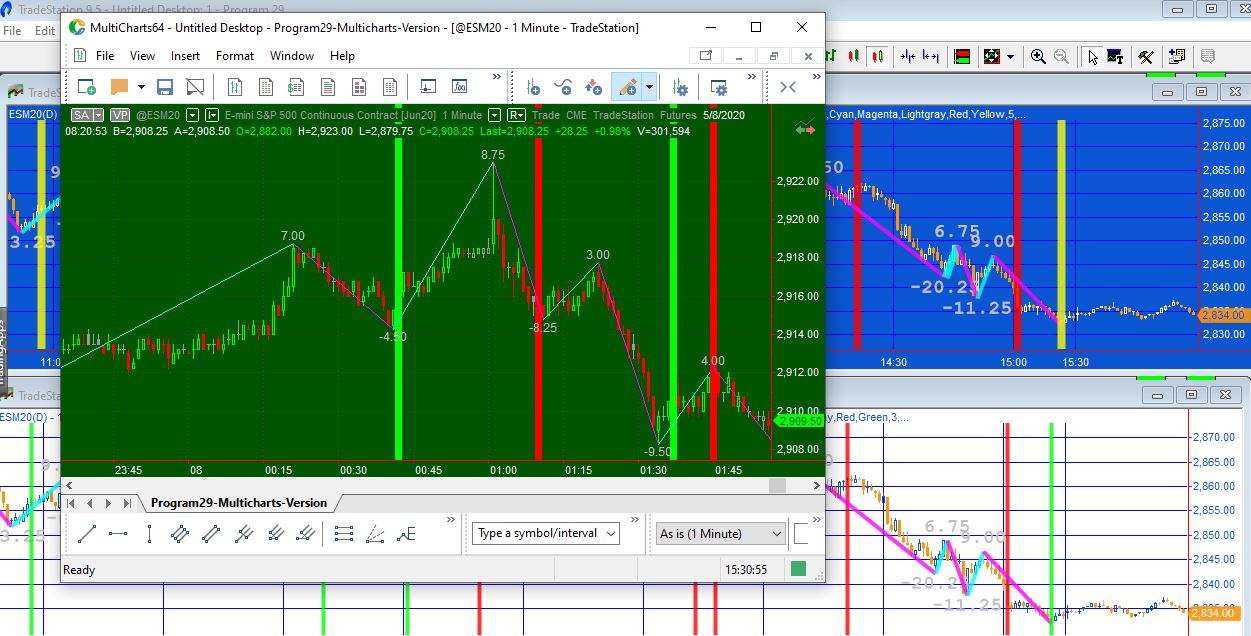
Program 29 | Zig Zag turning point predictor using the vector class
Program 29 uses program 26 and adds additional functionality to attempt to predict future zig zag turning points.
 The program works by calculating and storing the length of each horizontal zig zag move. Up and down moves are stored in separate vectors. In the case of up moves, it then averages the last up moves in terms of the number of bars over which they took place (the number depends on the user input: NumZigZagsInVector, so, for example, if NumZigZagsInVector were set to 1, only the last up move would be used. If it were set to 2 the last two up moves would be averaged.) Then, when a new bottom zig zag pivot is confirmed this average is added to the bar number of the bottom zig zag pivot and the result stored in an array of potential bars where potential zig zag bottom pivots may occur. This vector is read every bar to see if the current bar is stored in it. If it is, a vertical line is drawn on the chart.
More information can be found about program 29 here.
Program 29 (array version) | Zig zag estimator | Multicharts compatible
 Program 29 (array version) is a TradeStation and MultiCharts compatible ShowMe study based on Program 29. The original program used TradeStation EasyLanguage vectors and so did not work with MultiCharts. This program replaces the vectors with arrays. It uses historic horizontal zig zag moves (measured in numbers of bars) to attempt to estimate future zig zag turning points.
The program may be useful for you if you are interested in working with zig-zag patterns or learning more about EasyLanguage/PowerLanguage arrays.
Program 30 | TSI divergence

Program 30 looks for positive divergence between price and the True Strength Index (TSI). The download includes the unprotected program itself, with the following bonuses:
- a user guide in PDF format
- a video that describes how to easily modify the program to look for divergence between price and other oscillators (in the video I show how to convert the program to use RSI)
Program 30 works similarly to program 27 and program 28 which look for divergence between price and MACD and price and stochastics respectively. When a potential divergence is found, a line is drawn on the chart. The program also plots TSI, smoothed TSI and the difference between the two. More information, including a video, may be found here: https://markplex.com/easylanguage-programs/program-30-true-strength-index-tsi-divergence/
The download includes the following bonuses:
- a user guide in PDF format
- a video that explains how to modify the program to use a different indicator (e.g. RSI)
- a plain text version of the program
Program 31 | Trade planner
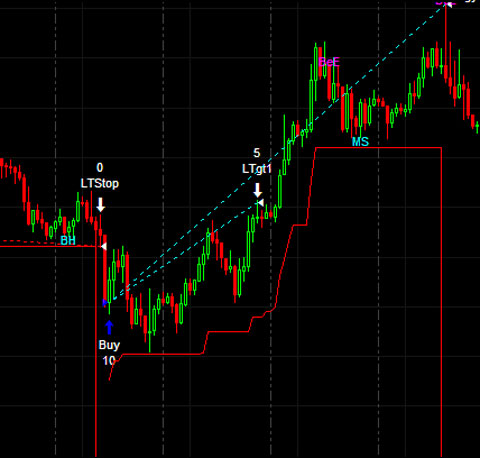
 Program 31 is a TradeStation EasyLanguage strategy developed using TradeStation 9.0 (and so is compatible with versions 9.0, 9.1 and higher). It is designed to help plan trades by drawing entry, target and stop lines on a chart, perhaps in conjunction with another indicator or show me study. The user also has the option to have the program place trades based on the values of the lines (see below) using program generated stop and limit orders.
I have also created a ‘sister’ indicator that includes plot values of the levels.
Program 32 | At what times the highs and lows of the day occur most frequently
 Program 32 is a TradeStation EasyLanguage ShowMe study developed in version 9.0 (and so is compatible with versions 9.0, 9.1 and higher). It stores that times at which the high of the day and the low of the day occurred. When each new day begins the program calculates at which times the highs and lows of the days have occurred most frequently. It then gives the user the option of plotting up to the top five most frequent of these times. The program makes extensive use of vectors to store high/low and time data.
Program 33 | Adaptive daily moving average plotted on intraday chart

Program 33 analyses high and low pivots and daily moving averages. Each time a new pivot high or low pivot is confirmed on the intraday chart, the program calculates a range of daily moving averages. It then sees which of these moving averages is closest to the pivot. The program then adapts this moving average to reflect the values of the moving averages closest to the last pivot and plots dots on the chart. This program makes extensive use of Price Series Provider that became available in TradeStation 9.0 (and so is compatible with versions 9.0, 9.1 and higher).
Click here to see more detail about this program.
This showme study plots both moving averages defined by the high pivots and the low pivots independently. A user input determines the left and right strength of the pivots.
Program 34 | Using a ‘block’ analysis to filter out market noise and discern price direction
 This new program collection consists of one indicator and two show me studies, all of which function independently. The programs use a ‘block’ analysis of bars where the block size is determined based on a multiple of Average True Range (ATR). The program counts how many of these ATR based blocks (if any, fit within each bar) and then calculates a price level. The programs are available for download and are unprotected.
The three programs are:
- An indicator that plots lines based on the market direction and extremes of the blocks (_Program34-MarkplexBlocks)
- A show me study that plots dots at the bar where the direction changes (_Program34-ShowMe)
- A support and resistance show me study that uses the levels where direction changes to attempt to ascertain levels of support and resistance (_Program34-SR).
You will find detailed information about the program here including a demonstration video.
Program 35 | Sending levels information from one chart to another

Click here for more information about program 35.
Program 35 consists of a sender and a receiver program that enable a user to set levels on one chart (the ‘sending’ chart) by moving horizontal lines around and for those levels to be, almost, instantaneously available on a second chart (the ‘receiving’ chart). The idea behind the program is that a user could determine levels or zones on the sending chart using whatever methodology he preferred, and that those same levels would become automatically available on the receiving chart.
Also, review Program 35 (ELCollections version), below.
The program, developed for TradeStation 9.0 (and so is compatible with versions 9.0, 9.1 and higher, although the ‘enable use of multiple CPU cores’ setting cannot be selected for this program to work), uses the global dictionary, the timer, an event handler, and vectors to store and transfer data from one chart to another.
Program 35 (ELCollections version) | Transfer levels from one chart to another
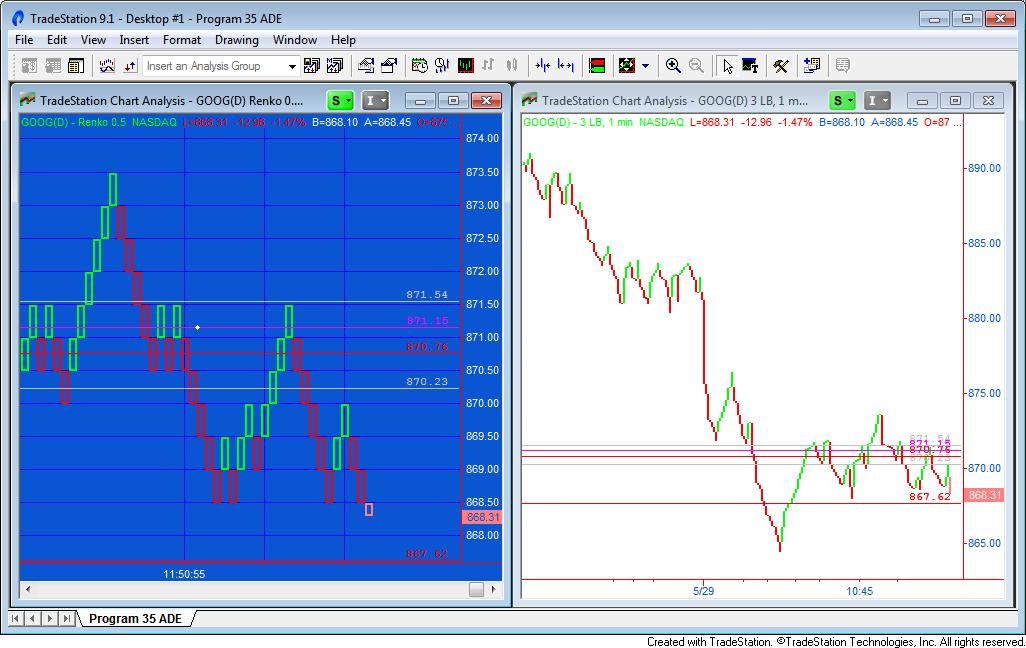
Program 35 (ELCollections version) consists of two programs: _Program35 ADE Sender and _Program35 ADE Receiver. They were designed to allow a user to set levels on one chart by moving horizontal lines with a mouse and for those levels to be, almost, instantaneously available on a second chart. The programs, developed for TradeStation 9.1 and up, were created using EL Collections. The idea behind the program is that a user could determine levels or zones on the sending chart using whatever methodology he prefers, and that those same levels would become automatically available on the receiving chart.
ELCollections and All Data Everywhere (ADE) are user developed programs that, among other things, allow you to transfer data from one chart to another. TradeStation has released a beta rewrite of the programs that works in multi core environments, i.e. the ‘enable use of multiple CPU cores’ setting can be selected. ELCollections must be installed for these programs to work. I have provided a link to a setup page on the TradeStation forum on the product page.
Program 35 (Globalvariable.dll version) | Transfer levels from one chart to another
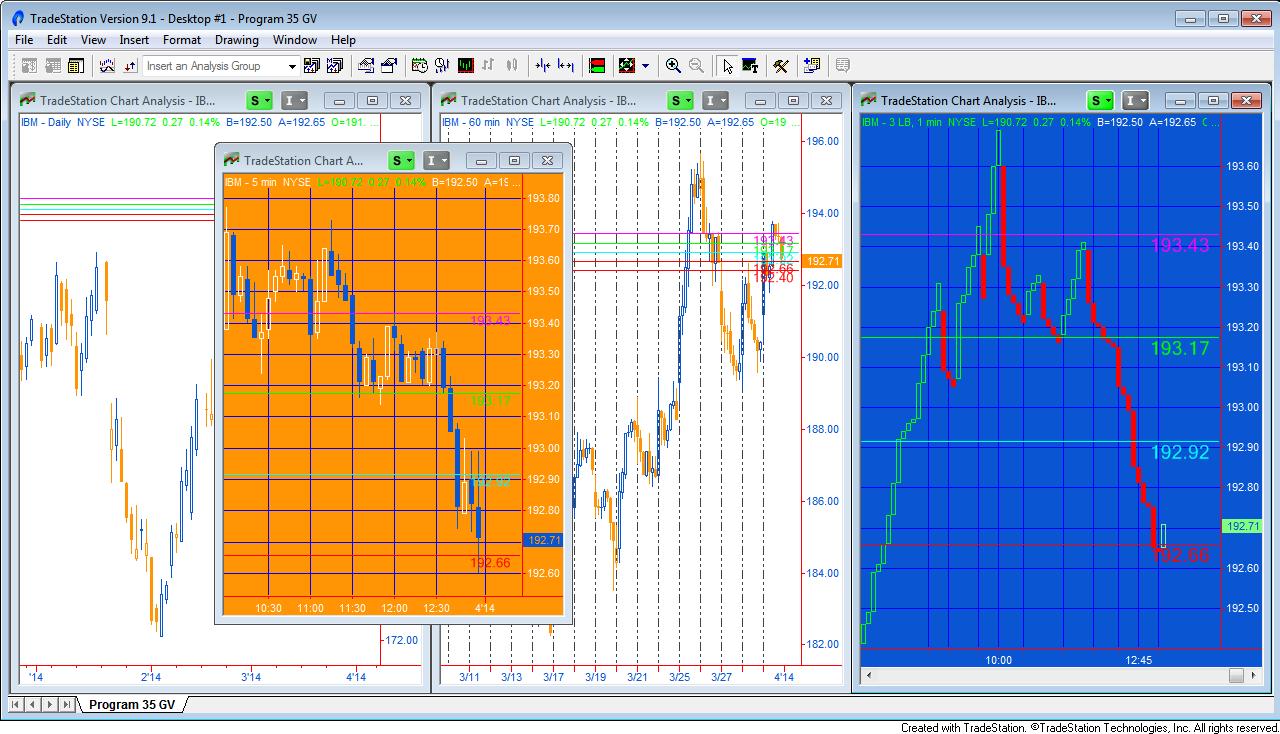
Program 35 (GlobalVariable.dll version) use the GlobalVariable DLL to transfer horizontal line levels from one chart to another (or several others). If a symbol is changed the indicators do not need to be turned off and applied in a specific order like they do with the ADE version. Program 35 (GlobalVariable.dll version) consists of two programs: _Program35 GV Sender and _Program35 GV Receiver. They allow a user to set levels on one chart by moving horizontal lines with a mouse and for those levels to be, almost, instantaneously available on a second chart. The programs, developed for TradeStation 9.1 and up and for them to work the GlobalVariable.dll must be installed. You can find out how to do this here: https://community.tradestation.com/Discussions/Topic.aspx?Topic_ID=113573
Program 35 (XML version) | Transfer data from one chart to another
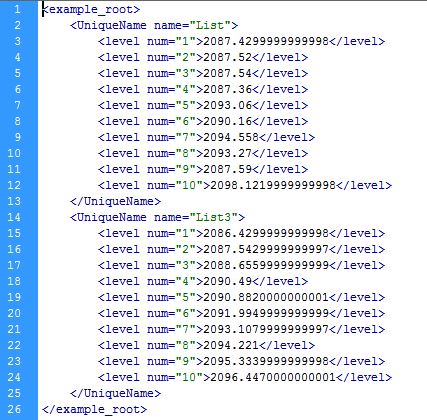
Program 35 (XML version) uses the TradeStation XML class to to transfer horizontal line levels from one chart to another (or from one chart to several others). The program is similar to the other Program 35 versions but has the advantage that levels are stored in an XML file stored on the user’s computer. If the sending chart is turned off, or the status of the sending program is set to ‘off,’ and then the program’s status is turned back to ‘on,’ the data is reloaded. If a line is moved on the sending chart, the corresponding line is also moved on the receiving chart.
The techniques used in this program will be useful if you wish to create an analysis technique in which you store data in a structured format for later retrieval by another TradeStation analysis technique or other program. The two programs are available for immediate download. I have also created a bonus video, at no additional cost, to show some aspects of the technology used in these programs.
Program 36 | Zig zag turning point predictor using price moves
For more information click here.

Program 36 calculates the price moves between zig zag turning points. It then averages the moves based on the NumZigZagsInVector user input. Once an upper zig zag pivot is confirmed the average of down moves is subtracted from the high zig zag pivot value and a horizontal line is drawn on the chart at this level until a new upward zig zag begins. Similarly, once a low zig zag is confirmed the average of up moves is added to the low zig zag pivot value and a horizontal line is drawn on the chart at this level until a new downward zig zag begins.
Program 36 also includes the functionality to calculate zig-zag patterns and calculate the difference between each high and the next low, and the difference between each low and the next high. The values are ‘drawn’ on the chart to the appropriate number of decimal places. The user can change the color of the zig zag lines and the text. The program also compares each downward zig zag with the previous downward zig zag. If the new downward zig zag is within a user defined tolerance of the previous downward zig zag, the thickness of the current downward zig zag is increased to a user defined value. Similarly, if the new upward zig zag is within a user defined tolerance of the previous upward zig zag, the thickness of the current upward zig zag is increased to a user defined value. This provides a visual cue that the ‘matching’ zig zag lengths have occurred.
The UNPROTECTED program (i.e. TradeStation EasyLanguage show me study) DEVELOPED IN VERSION 9.0 (and so is compatible with versions 9.0, 9.1 and higher) of TradeStation is available for immediate download for $44.95. As well as the TradeStation ELD file I am including a text version in the download. Since the program is unprotected you are free to study the code and modify it for your own purposes.
Click the ‘add to cart’ button to pay using Credit card or PayPal. Gold Pass members are eligible for 20% off this price when they type in their special discount code (see https://markplex.com/gold-pass-content/ to get the latest code).
Program 37 | Finding historic gaps that have not been filled
Click here for more information about program 37

Program 37 shows at which historic price levels gaps have occurred which have not yet been “filled” by price action. It defines gaps as when the open of a new day is different from the close of the previous day, so an up gap would occur when the open of the new day was higher then the previous close. A down gap would occur when the open of the new day was lower then the close of the previous day.
Program 37 can be used with symbols such as @ES.D, @YM.D, equities or custom sessions, where gaps may occur between one daily session and the next. It can be used with intraday and tick charts. The gap information is displayed on the right of the chart as two horizontal lines and a vertical line.
The number of gaps that the program recognizes is determined by a user input (up to a maximum of 100). Once a gap has been filled the display is removed from the chart.
The UNPROTECTED program (i.e. TradeStation EasyLanguage show me study) DEVELOPED IN VERSION 9.0 (and so is compatible with versions 9.0, 9.1 and higher) of TradeStation is available for immediate download for $49.95. Click the ‘add to cart’ button to pay using Credit card or PayPal. Gold Pass members are eligible for 20% off this price when they type in their special discount code (see https://markplex.com/gold-pass-content/ to get the latest code). The download includes the TradeStation ELD and a plain text version. The program is MultiCharts compatible.
Program 38 | Trend with pull back
Click here for more information about program 38.
 Program 38 looks for trends followed by pull backs.
It attempts to highlight trends by calculating linear regression lines over several bars. If the slope is steeper than a certain amount and the average of the absolute distance between the potential trend line and the bars over which the calculation is made is less than a certain amount (I call this the ‘trending coefficient’ ), program 38 assumes the line is a trend.
Program 38 then searches for pivots. If the end of a qualifying trend line occurs within a user defined number of bars of the pivot, and, in the case of an up trend the pivot is lower than the end of the trend line, or, in the case of a down trend the pivot is higher than the end of the trend line, then a ‘dot’ is plotted on the pivot confirming bar indicating a “pull back.”
The UNPROTECTED programs (i.e. TradeStation EasyLanguage show me study and its associated function) DEVELOPED IN VERSION 9.0 of TradeStation (and so is compatible with versions 9.0, 9.1 and higher) are available for immediate download for $89.95. Click the ‘add to cart’ button to pay using Credit card or PayPal. Gold Pass members are eligible for 20% off this price when they type in their special discount code (see https://markplex.com/gold-pass-content/ to get the latest code). The download includes:
- TradeStation ELD of the ShowMe study and the function
- A plain text version of the ShowMe study and the function
- A bonus video that explains how to use the Markplex linear regression function included in the download
Program 39 | Multiple symbol stochastics

Click here for more information about program 39.
Program 39 uses the Price Series Provider to calculate and plot stochastic oSlowD for eleven symbols. The program works on intraday and daily charts and was developed in TradeStation 9.0 (and so is compatible with versions 9.0, 9.1 and higher).
The advantage of using the Price Series Provider is that the indicator can be applied to one specific symbol while providing stochastic information about others. The same result could be achieved by using multiple data streams but the time taken to set up the chart is much longer.
The UNPROTECTED program (i.e. TradeStation EasyLanguage indicator) DEVELOPED IN VERSION 9.0 of TradeStation (and so is compatible with versions 9.0, 9.1 and higher) are available for immediate download for $59.95. Click the ‘add to cart’ button to pay using Credit card or PayPal. Gold Pass members are eligible for 20% off this price when they type in their special discount code (see https://markplex.com/gold-pass-content/ to get the latest code).
Program 40 | Markplex Direction Finder
More details about Markplex Direction Finder.
 The Markplex Direction Finder is a TradeStation EasyLanguage PaintBar study designed to show price ‘direction’ in price action on a chart. The program works by analyzing slope together with chart conditions based on a proprietary combination of price momentum indications. Bars are colored based on the programs‘ calculation of the price direction. User inputs determine the color that bars are painted when in a bullish or bearish direction. The program uses the GradientColor reserved word to paint bars somewhere in the range of colors between these user inputs. The colors are calculated at the end of the bar. The program was developed using TradeStation 9.0 (and so is compatible with versions 9.0, 9.1 and higher).
Program 41 | Chart congestion finder
More details about program 41–chart congestion finder
 Program 41 looks for ‘price congestion’ on a chart by searching pivots that are lined up with each other. Each time a new pivot is confirmed, the program checks to see if a line can be drawn that is ‘close’ to going through the three most recent pivot points. Once high pivots are found the program searches to see if two low pivots have occurred after the oldest high pivot. Similarly, once low pivots are found the program searches to see if two high pivots have occurred after the oldest low pivot. Assuming the high and low pivot lines are converging, the program then draws lines through them. Show me dots are drawn to continue the lines provided they are not breached by price.
The UNPROTECTED program (i.e. TradeStation EasyLanguage indicator) DEVELOPED IN VERSION 9.0 of TradeStation (and so is compatible with versions 9.0, 9.1 and higher) are available for immediate download for $69.95. Click the ‘add to cart’ button to pay using Credit card or PayPal. Gold Pass members are eligible for 20% off this price when they type in their special discount code (see https://markplex.com/gold-pass-content/ to get the latest code).
Program 42 | RSI Divergence Indicator and Showme Study
See more information about the RSI Divergence Indicator and Showme Study, here
Program 42 consists of a TradeStation Indicator and ShowMe study developed using EasyLanguage that searches for potential divergences between price and the Relative Strength Index (RSI).

In addition to looking for divergence, program 42 plots RSI and an exponential moving average of RSI.
When a potential divergence is found a line is drawn between price pivots corresponding to pivots in the RSI. Since price and RSI pivots do not necessarily occur on exactly the same bar, the program has a user input to determine how many bars apart the price pivot and the RSI pivot can occur. The price pivot can occur before the RSI pivot, or vice versa.
Program 43 | Trend and compression/consolidation finder
Click here to find out more about program 43 – (trend and compression/consolidation finder)
 Program 43 is an EasyLanguage paintbar study, developed in TradeStation 9.0 (and so is compatible with versions 9.0, 9.1 and higher) the looks for areas of price consolidation or compression. If it considers that price is in an area of compression to ‘paints’ the bars a user defined color. The download includes a companion indicator. There is also a bonus video for Gold Pass members that explains how to find the average of the last several high pivots in the compression factor using an array.
This unprotected and commented programs (i.e. the TradeStation EasyLanguage paintbar study and indicator) are available for immediate download for $39.95 by clicking the ‘add to cart’ button. You can pay with credit card or PayPal.
As usual, Gold Pass members get an additional 20% discount off all program and tutorial prices. If you are a Gold Pass member make sure you enter the special coupon code to get 20% discount off these prices.
Program 44 | CCI ghost finder
 Visit CCI ghost finder to find our more about this program, including a demonstration video.
Program 44 is designed to look for ‘ghost’ patterns in the Commodity Channel Index (CCI). Some view ghost patterns as a sign of a potential reversal. The program defines a bearish ‘ghost’ pattern as one where there are 3 high pivots and the middle pivot is higher then the ones on either side.
Similarly, a bullish ‘ghost’ pattern is one where there are 3 low pivots and the middle pivot is lower then the ones on either side.
The unprotected EasyLanguage indicator and protected smoothed CCI function are available for immediate download for $74.95 by clicking the ‘add to cart’ button. You can pay with credit card or PayPal.
The latest version includes Alert functionality.
As usual, Gold Pass members get an additional 20% discount off all program and tutorial prices. If you are a Gold Pass member make sure you enter the special coupon code to get 20% discount off these prices.
Program 45 | CCI Zero Rejection finder
 Program 45 is designed to look for ‘zero rejection’ patterns in the Commodity Channel Index (CCI). Some view zero rejection patterns as a sign of a potential reversal.
The program is user configurable and the user may look for zero rejection patterns on regular CCI, Fast CCI, Markplex smoothed CCI or Markplex fast smoothed CCI.
The CCI itself is configured by the following inputs: CCILength, FastLength, SmoothLength and FastSmoothLength.
The unprotected EasyLanguage indicator and protected smoothed CCI function are available for immediate download for $29.95 by clicking the ‘add to cart’ button. You can pay with credit card or PayPal.
Program 45 is compatible with MultiCharts and TradeStation
As usual, Gold Pass members get an additional 20% discount off all program and tutorial prices. If you are a Gold Pass member make sure you enter the special coupon code to get 20% discount off these prices.
Program 46 | Strategy blueprint
Click here for more information about program 46.
 There are some circumstances where you may have an idea for a new TradeStation strategy but you would like to get an idea of how it would work out before the expense and time needed to create an actual strategy. Program 46 enables you to test out your ideas by adding text objects to chart (‘B’ = buy, ‘S’ = sell, “BC’ = buy to cover, and ‘SS’ = sell short). Once the chart is refreshed you will see trades coincident with the text objects. The program also includes targets, a trailing stop and stop functionality. The program could be used in conjunction with indicators or show me studies.
Click here for more information about program 46.
This program is available for immediate download for $59.95 by clicking the ‘add to cart’ button below. You may pay using PayPal or a credit card.
As usual, Gold Pass members get an additional 20% discount off all program and tutorial prices. If you are a Gold Pass member make sure you enter the special coupon code to get 20% discount off this price.
There is also a MultiCharts version of this program.
Program 47 | CCI Ghost strategy
 Some view ghost patterns as a sign of a potential reversal. Program 47 (based on program 44) is designed to look for ‘ghost’ patterns in the Commodity Channel Index (CCI) and make trades based on either:
- A confirmed ghost or inverted ghost pattern
- A break of the ‘trend line’ drawn across the ‘shoulders’ of the ghost or inverted ghost pattern
For more information and a video explanation.
The program is available for download. The download includes program 47 (unprotected), the original program 44 (unprotected), the _MarkplexCCI function (protected), a bonus video that explains some of the changes I made to program 44 to ‘convert’ it into a strategy, and the workspace used in the demonstration videos (in zip format)
.
A MultiCharts version is also available. See the program 47 page for more information.
Program 48 | Trade planner and fib tool
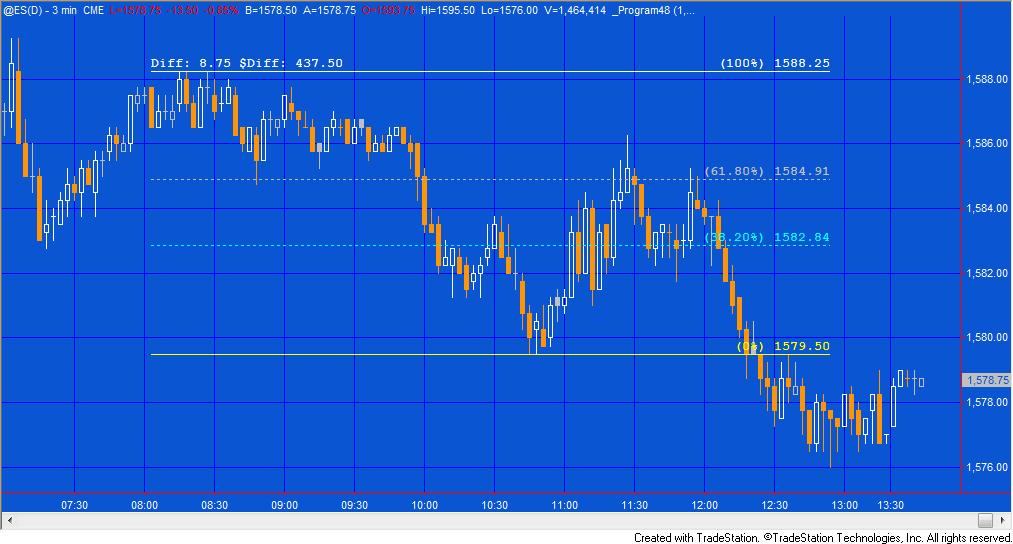
Program 48 draws two horizontal lines on a chart and fib retracement lines at 38.2%, 61.8%, 138.2% and 161.8%. If either the top or bottom line is moved then the Fibonacci levels are adjusted. In addition the lines can be calculated from top to bottom or bottom to top, depending on a user input.
The tool also displays, as text above the top or bottom lines, the distance between the two lines and that distance expressed in money terms. For currencies that are not denominated in the currency set for your TradeStation account, a conversion is made automatically. In addition to being able to be moved up and down, the lines may also be stretched to the right or left.
An unprotected version of program 48 is available for download for $29.95
As usual, Gold Pass members get an additional 20% discount off all program and tutorial prices. If you are a Gold Pass member make sure you enter the special coupon code to get 20% discount off these prices. You can find the coupon code on the Gold Pass page.
Program 49 | Markplex P & F simulator for bar charts
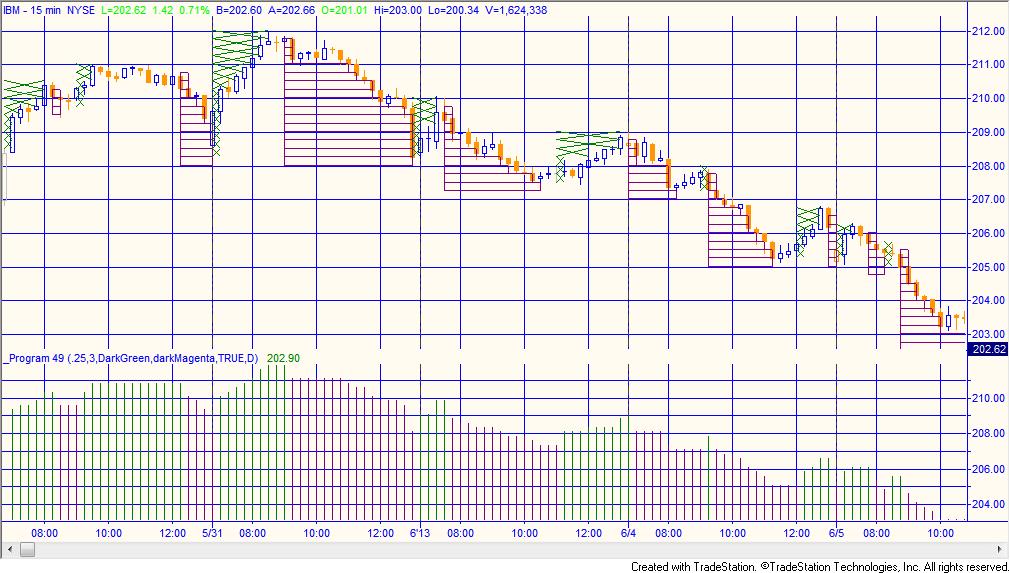
Program 49–Markplex Point & Figure Simulator is a TradeStation EasyLanguage indicator designed to ‘overlay’ point & figure (P&F) boxes on a regular chart. The purpose in creating it was to be able to see the ‘pure’ filtered price movement that can be seen on a point and figure chart on a regular chart, I hope to create some additional studies and, perhaps, strategies based on the framework created in this program.
Program 49 was designed for TradeStation 9.1 and above. It works on intraday daily, weekly and monthly charts.
An unprotected version of program 49 is available for download for $94.95
A special discounted bundle of programs 49 and 50 is available for $125.95. This is more than a 25% discount off the cost of buying the two programs separately.
I have recorded a short video that demonstrates how to use the Markplex.com shopping cart to immediately download a program and import it into TradeStation.
Gold Pass members get an additional 20% discount off all program and tutorial prices. If you are a Gold Pass member make sure you enter the special coupon code to get 20% discount off these prices. You can find the coupon code on the Gold Pass page.
Program 50 | Point and figure turning points and support and resistance
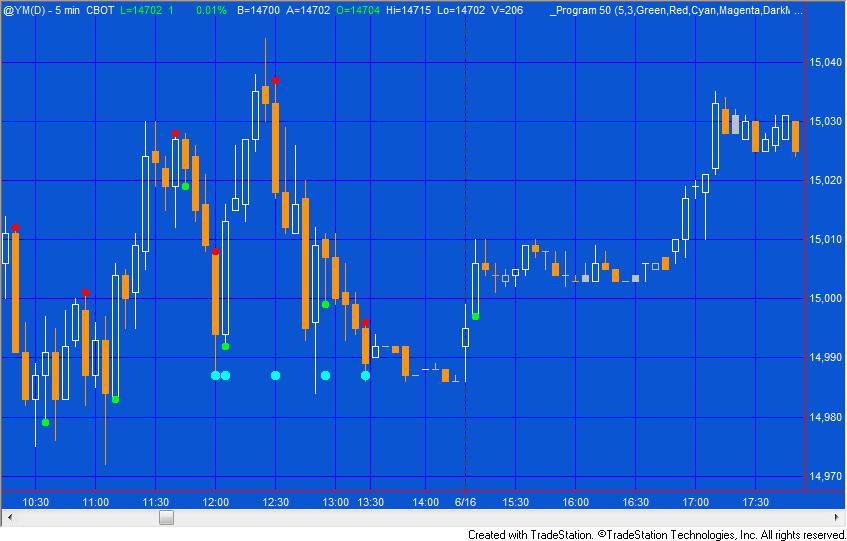
Program 50 | Point and figure turning points and support and resistance is a TradeStation EasyLanguage show-me study designed to show point and figure behavior on regular bar charts. Program 50 is similar to program 49, however, rather than drawing crosses and boxes on a chart, program 50 plots a dot on the chart when a newline of Xs would start to be drawn on a point and figure chart and another dot when price changes direction. A user input determines the color of the dots.
The program also highlights some support and resistance patterns and draws lines, in real time, to show the levels at which a new virtual box or cross is drawn, or a reversal occurs.
Program 50 was designed for TradeStation 9.1. It works on intraday, daily, weekly and monthly charts.
An unprotected version of program 50 is available for download for $74.95.
A special discounted bundle of programs 49 and 50 is available for $125.95. This is more than a 25% discount off the cost of buying the two programs separately.
Gold Pass members get an additional 20% discount off all program and tutorial prices. If you are a Gold Pass member make sure you enter the special coupon code to get 20% discount off these prices. You can find the coupon code on the Gold Pass page.
Program 51 | Line break/P&F functions with demonstration show me study

Program 51 consists of a line break function and a point and figure function, together with a demonstration show me study.
Rather than drawing boxes or crosses the functions return 1 or -1 depending on what the direction would currently be shown on a line break or point and figure (depending on which function is used).
Both line break and point and figure charts ignore time. With line break charts, new up lines are only added when a bar closes higher than the high of the previous up line. Once up lines are being drawn price has to go below the low of a specified number of up lines in order to create a new down line. New down lines are only added when a bar closes below than the low of the previous down line. Once down lines are being drawn price has to go above the high of a specified number of down lines in order to create a new up line.
With point and figure charts, crosses are drawn for rising prices, one above another. For falling prices circles or boxes are drawn on a point and figure chart, one below the other.
The showme study included with program 51 calls both the functions described above. When both functions are showing a potential upward bias it plots dots of one color. When both functions indicate a potential downward bias, dots are plotted of another color. The dots are plotted using trailing value so that upward dots can only be plotted at a higher low and downward dots can only be plotted at lower high.
Program 51 was designed for TradeStation 9.1. It works on tick, intraday, daily, weekly and monthly charts.
I have recorded a short video that demonstrates how to use the Markplex.com shopping cart to immediately download a program and import it into TradeStation.
Gold Pass members get an additional 20% discount off all program and tutorial prices. If you are a Gold Pass member make sure you enter the special coupon code to get 20% discount off these prices. You can find the coupon code on the Gold Pass page.
Program 52 | Markplex modified Renko charting
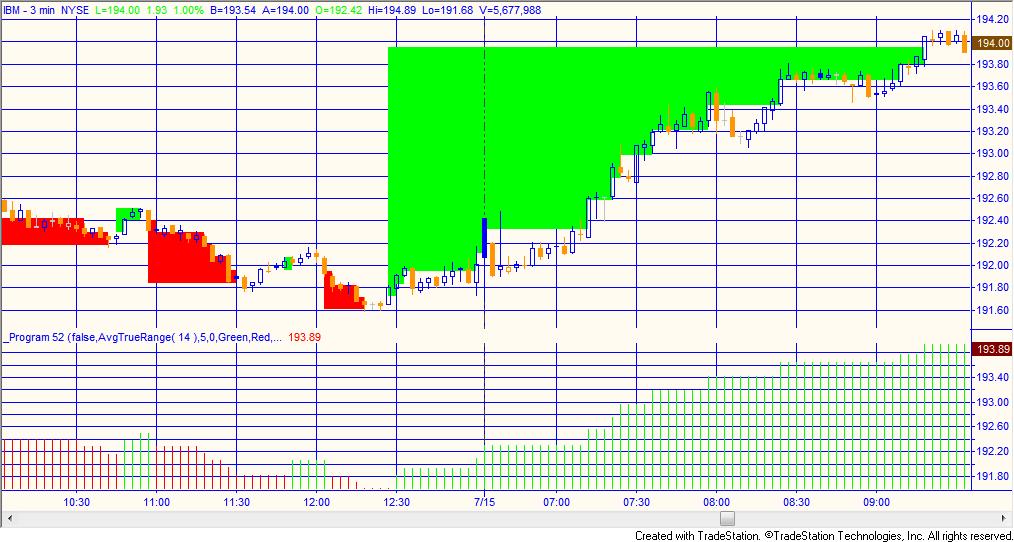
Program 52 | Markplex modified Renko charting is a TradeStation EasyLanguage indicator designed to draw modified Renko-like boxes on a regular bar chart. Reversals are drawn when a modified box moves one box in a new direction (according to the rules explained below). This program also allows the user to set up a fixed modified Renko box size or one that varies depending on the average true range. If you choose a variable box size, the default setting is: AvgTrueRange( 14 ).
Since normal Renko boxes do not have a time element, program 52 ‘stretches’ boxes to accommodate the regular chart.
Renko charts are normally created using tick data. Since this program uses the underlying bar data, it operates in a slightly different way. The user has the option of using the high-low methodology or the close methodology. In each case only one price is used to determine whether a new ‘virtual’ box is drawn.
Program 53 | Markplex Twitter app
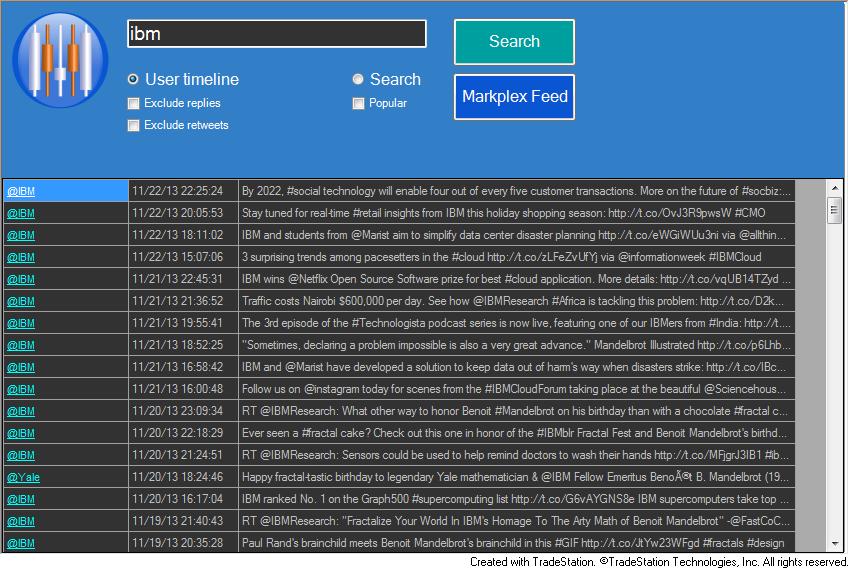
Twitter is an online social networking and microblogging service that enables users to send and read ‘tweets,’ which are short text messages limited to 140 characters or less. To post tweets a user needs to register at twitter.com, but anyone can read them.
Twitter is increasingly used as a way of sharing information and news, sometimes far in advance of when it might appear in traditional news sources.
The Markplex Twitter app is a TradeStation TradingApp® designed to allow a trader to find ‘tweeted’ information about a particular stock or other keyword right on the TradeStation desktop. Because it is an app, it does not need to be connected with a specific chart, or RadarScreen.
Program 54 | Markplex hammer pattern strategy
Program 54 looks for hammer patterns (see my definition of hammer patterns on the program page) in up and down trends to initiate trades. To initiate a short trade it looks for a hammer pattern in a down trend and to initiate long trades it looks for an ‘inverse’ hammer pattern in an up trend.
The program contains several user defined filters to attempt to ascertain trend direction. By default these consist of:
- Finding the slope angle of an exponential moving average by using linear regression.
- Calculating the daily moving average and calculating whether it has risen or fallen over the last day.
The programs also contains other filters in the source code that you may also use. These include the Markplex three line break and point and figure functions that I introduced in program 51. These are included with the download, as is a bonus video that demonstrates how to modify the filters.
Program 54 was designed for TradeStation 9.1 (update 22 and above), 9.5, 10.0 and future versions. It works on intraday, daily, weekly and monthly charts.
Program 55 | Support and resistance lines based on historical pivots
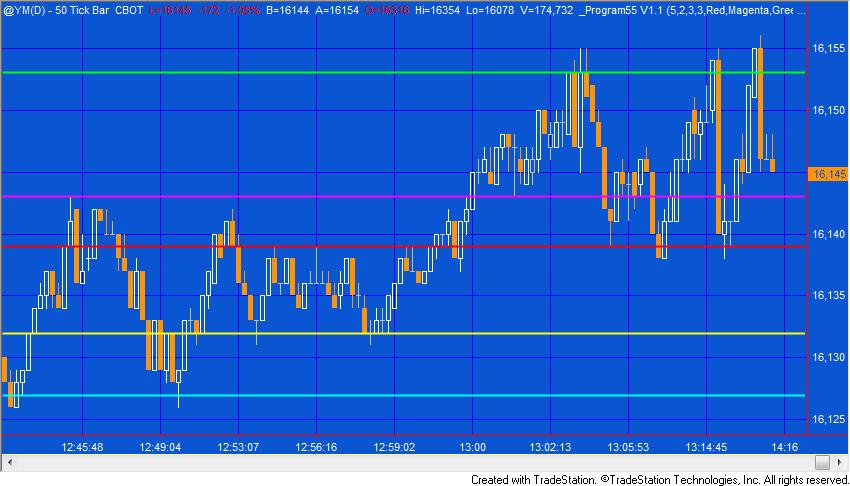
Program 55 creates horizontal support and resistance lines based on the record of levels of previous pivots. The idea behind the program is that if pivots have occurred at a specific level before then that price level may have some significance, especially if they have occurred at the same level (or near to the same level) on several occasions before.
Program 55 stores information about every pivot on the chart (after the program starts calculating) and resamples this vector to populate a smaller vector that just contains levels within the visible area. These levels are ranked based on the number of occurrences at a specific level and the recency of the last pivot at that level.
Program 55 was designed for TradeStation 9.1 (update 22 and above). It works on tick, intraday, daily, weekly and monthly charts. This program will not work in MultiCharts because it uses the TradeStation collections and other functionality that is not available in the MultiCharts environment.
Program 56 | Volume profile support and resistance
Click here for more information about program 56.
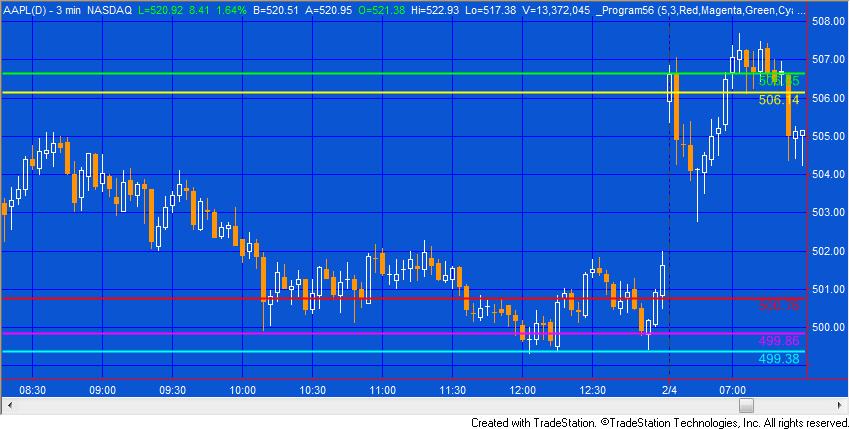
Program 56 creates horizontal support and resistance lines based on the chart’s volume profile.. The theory underlying program 56 is that if significant volume has occurred at a specific price level then that level may have some significance as an area of support and/or resistance.
Program 56 draws color coded and styled horizontal lines (depending on user inputs) on the chart together with price labels. Program 56 stores volume information at all price levels for all bars loaded (after MaxBarsBack) and uses this information to find volume profile pivots. See the video on the product page for more information.
Program 57 | Volume profile for a user specified time period
Visit the program 57 program page for more information
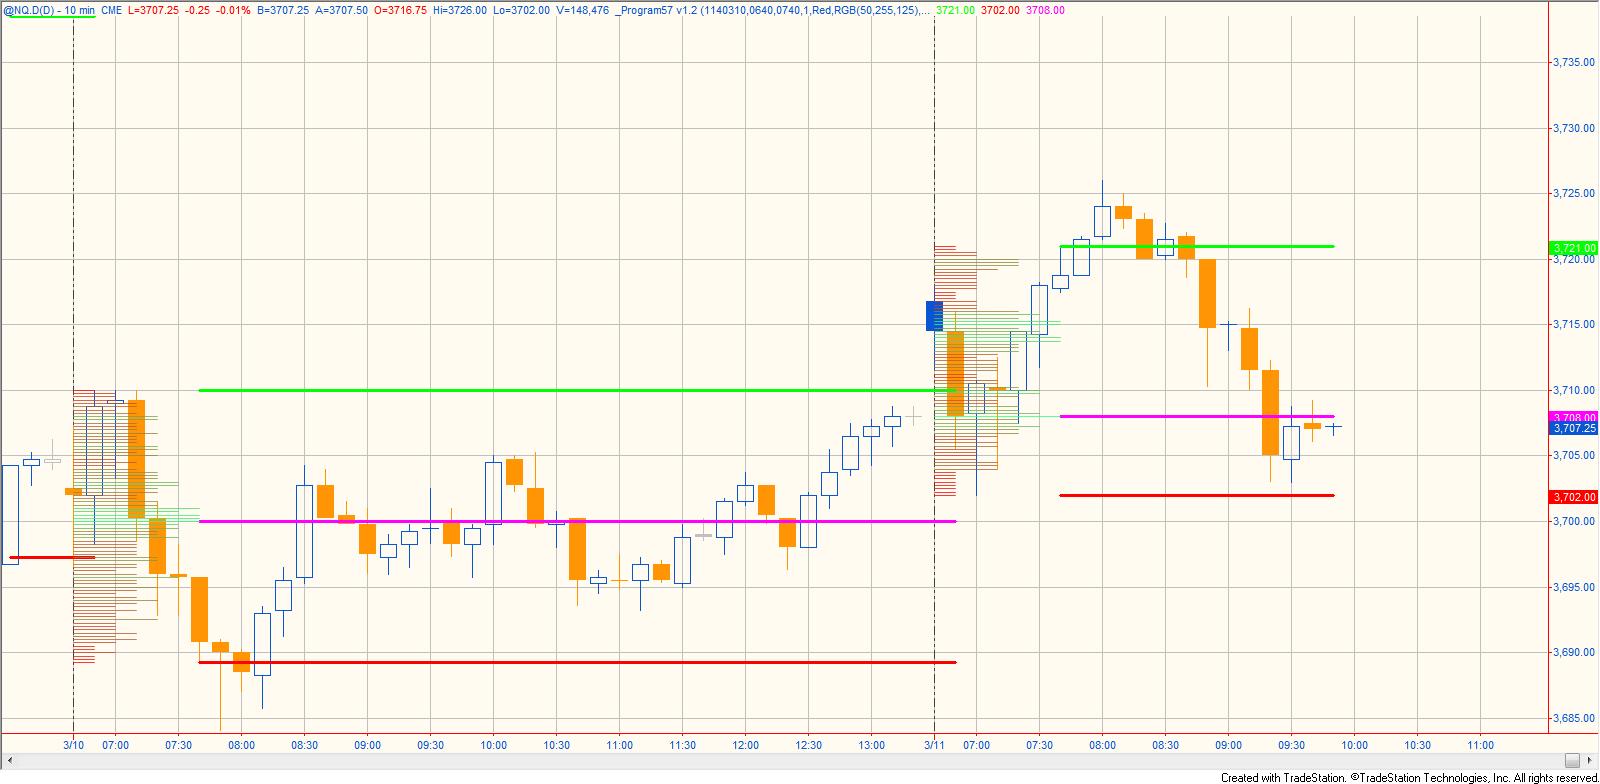
Program 57 uses the TradeStation Price Series Provider to create a volume profile for a specified period in the day. This period could be the first hour of trading, for example. The profile is drawn on the chart in the period being analyzed . The profile is color coded between 2 user specified colors. Having calculated the volume profile, program 57 then calculates at which price level most volume occurred during the period being analyzed. It then plots 3 horizontal lines at the following levels:
- The price high of the period being analyzed
- The price low of the period being analyzed
- The price at which the highest volume occurred during the period being analyzed
Program 58 | Markplex P&F, line break, Markplex Renko and block analysis functions and demonstration show-me study
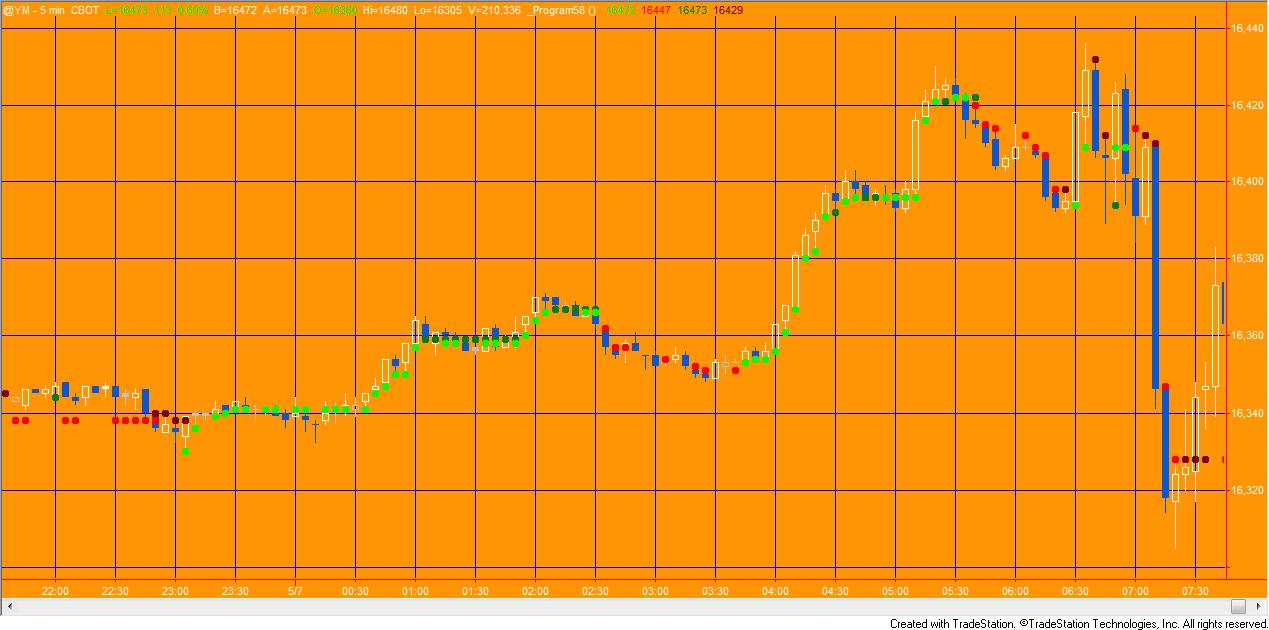 Program 58 consists of four functions:
- Markplex P&F (based on the technology behind program 49),
- line break (based on program 3),
- Markplex Renko (based on program 52),
- and block analysis (based on program 34)
and a demonstration show-me study. The functions return 1 when the underlying technique returns up boxes, bars or lines (depending on the technique) and -1 when the underlying technique returns down boxes, bars or lines. The functions may be used independently of each other. These programs are MultiCharts compatible.
Click here to read more about program 58.
Program 58 was designed for TradeStation 9.1 (and higher) and MultiCharts. It works on intraday, daily, weekly and monthly charts.
The download includes a TradeStation ELD file (containing the show-me study and functions), a MultiCharts PLA file (containing an indicator and functions) and a BONUS video that demonstrates some ways of using the functions in a strategy.
Program 59 | Bollinger band ‘squeeze’ and Keltner breakouts
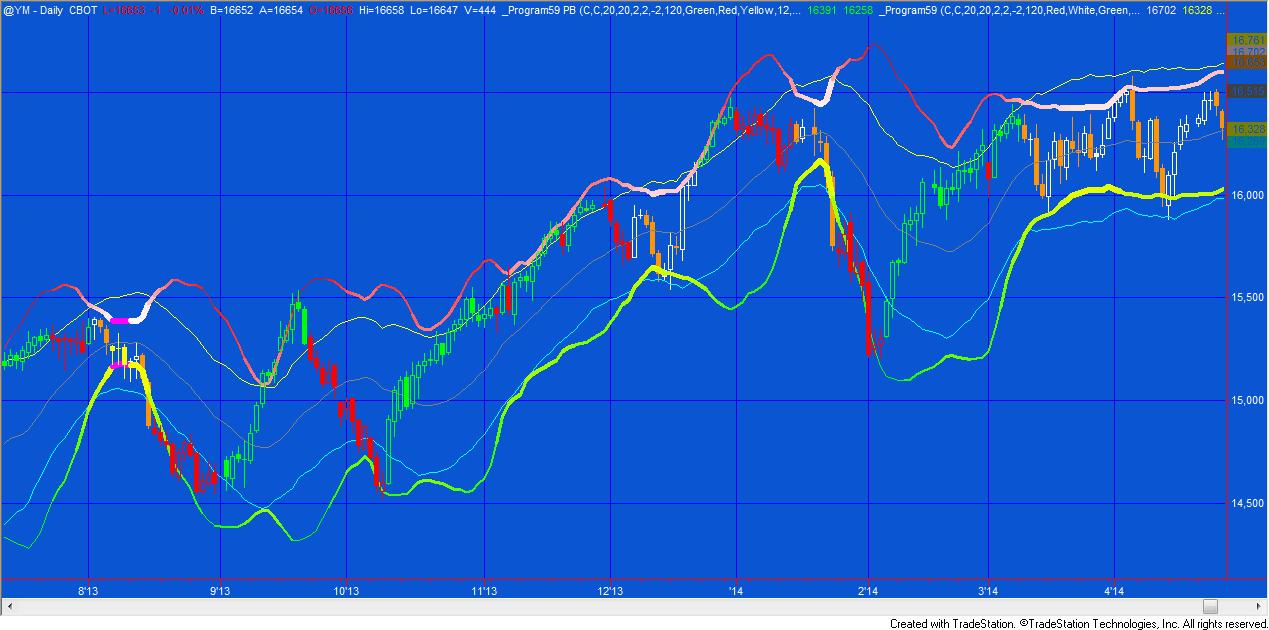
A narrowing of Bollinger bands is an indication of lower volatility. According to John Bollinger (who created the Bollinger band concept), periods of low volatility are often followed by periods of high volatility. This could mean that a narrowing of the Bollinger bands (or a period of low volatility) –a ‘squeeze’–may foreshadow a period of higher volatility, or a breakout in price. Another way of looking at expansion of volatility is when the Bollinger bands cross outside a Keltner channel.
Program 59 searched for both constriction in the height of the Bollinger band and where the Bollinger bands move outside the Keltner channel. It actually includes two programs:
- _Program59 (an indicator)
- _Program59 PB ( a paintbar study)
The indicator plots upper and lower Bollinger bands. When a ‘squeeze’ occurs (i.e. when the height of the Bollinger band is less than or equal to the height of a user defined number of bars, in this case the default is set to 120 bars) the upper and lower bands are plotted in a user input color. In order to give a quick visual indication to the user, the bands are also colored on a gradient between two user input colors and their thickness modified depending on the height of the Bollinger bands over a user input number of bars.
The paintbar study paints bars as follows:
- When the upper Bollinger band is above the upper Keltner channel line and the slope of the MACD is up, bars are colored according to are the AboveColor1 user input.
- When the lower Bollinger band is below the lower Keltner channel line and the slope of the MACD is down, bars are colored according to are the BelowColor1 user input.
- When the height of the Bollinger band is the smallest in the last NumBars bars the bars are colored according to the SqueezeColor user input.
The download includes a TradeStation ELD file (containing the indicator and paintbar study), and a MultiCharts PLA file (containing the indicator and paintbar study).
Gold Pass members get an additional 20% discount off all program and tutorial prices. If you are a Gold Pass member make sure you enter the special coupon code to get 20% discount off these prices. You can find the coupon code on the Gold Pass page.
Program 60 | Stochastic RSI

Program 60 consists of a stochastic of the RSI indicator and show me study. The stochastic of the RSI can be helpful in identifying potential tops and bottoms on a chart.
Click here for more information about program 60.
The program 60 packages includes:
- An indicator (_Program60) that plots the stochastic of RSI and a smoothed version of the stochastic of RSI. It also looks for divergence between price and either the stochastic of RSI or the smoothed version of the stochastic of RSI, depending on a user input. When divergence is found, lines are drawn between the price points on the chart.
- A show me study (_Program60-ShowMe) that plots at the turning points of the stochastic of RSI or the smoothed version of the stochastic of RSI, depending on a user input. It is filtered according to a stochastic being overbought or oversold.
- Gold pass members can also access a free video below that shows how to use a GlobalValue to communicate a user input from the indicator to the show me study.
The program 60 programs work with charts, RadarScreen and Scanner and with both TradeStation and MultiCharts. An ELD file containing both programs may be downloaded for $49.95.
As always, Gold Pass members get an additional 20% discount off all program and tutorial prices. If you are a Gold Pass member make sure you enter the special coupon code to get 20% discount off these prices. You can find the coupon code on the Gold Pass page.
Program 61 | Smoothed Markplex CCI and volume indicator
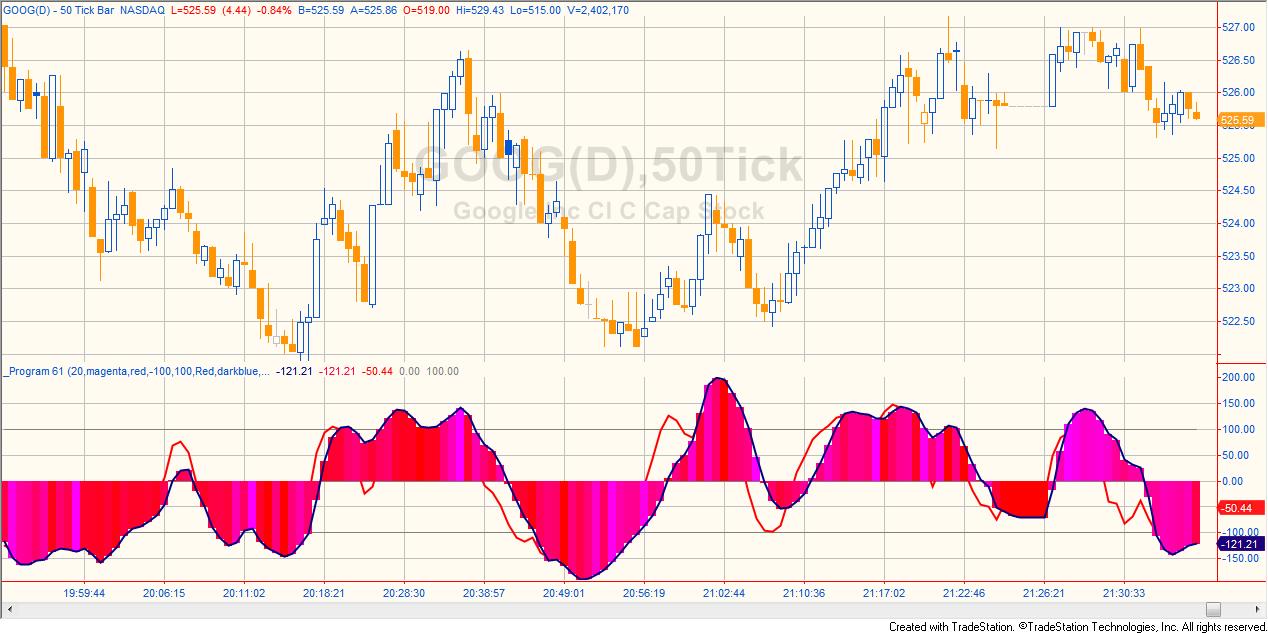
Program 61 consists of an indicator and the protected smoothed Commodity Chanel Index (CCI) function. The indicator plots the Markplex smoothed CCI, the Markplex fast smoothed CCI and a histogram of the Markplex smoothed CCI that is colored based on the bar volume compared to the volume of a user input number of bars. This allows the user to get an idea of whether the current bar is relatively high volume bar compared to the bars before.
The programs work with both TradeStation and MultiCharts. An ELD file containing both programs may be downloaded for $44.95.
Gold Pass members get an additional 20% discount off all program and tutorial prices. If you are a Gold Pass member make sure you enter the special coupon code to get 20% discount off these prices. You can find the coupon code on the Gold Pass page.
Program 62 | Stochastic, RSI, TSI, CCI, MACD, and stochastic RSI divergence
Visit the program 62 program page here.
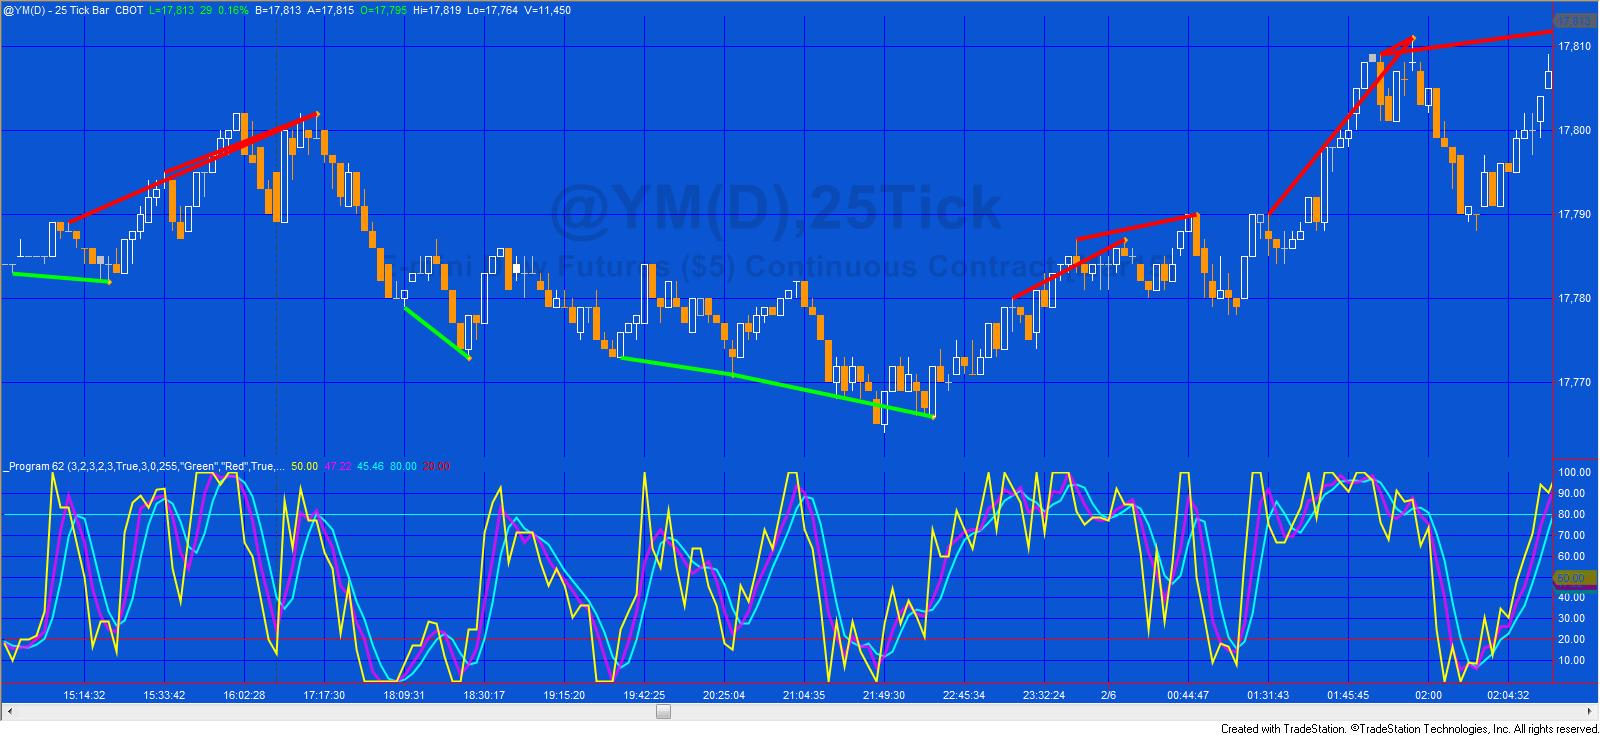
Some technical analysts believe that bullish and bearish divergences in an oscillator may foreshadow price reversals. Program 62 is a TradeStation EasyLanguage indicator designed to look for potential divergences between price and a user selected oscillator from the following list:
- Stochastic
- Relative Strength Index (RSI)
- True Strength Index (TSI)
- Commodity Channel Index (CCI)
- Moving Average Convergence/Divergence (MACD)
- Stochastic of RSI
Program 62 combines the capabilities of programs 27, 28, 30, 42, and 60 in ONE program. I have rewritten the program to calculate divergence for any of the above oscillators (selectable by a user input). The program also works with second, tick, kagi, Kase, line break, momentum, point and figure, range, renko charts. There were difficulties with programs 27, 28, 30, and 42, in drawing the divergence lines between pivots because various bars shared the same time stamp. This is no longer a problem as program 62 uses the new TradeStation drawing objects. Unfortunately the program will not work with MultiCharts.
An UNPROTECTED version (i.e. the TradeStation EasyLanguage indicator is fully functional and you can see the source code) is also available for for immediate download for $245- by clicking the ‘add to cart’ button. Because this version is unprotected you can open it, see the program code and modify it.
Program 63 | Linear regression plot and oscillator
To learn more about program 63, click here.
 Program 63 draws linear regression lines, and then creates a smoothed plot based on the linear regression end point. It also offers the option to plot oscillators based on non-smoothed plots.
Program 63 was developed for TradeStation 9.5 and above and is not compatible with MultiCharts.
If you are a Gold Pass member make sure you enter the special coupon code to get an immediate 20% discount off this prices.
Program 64 | advanced turning point finder
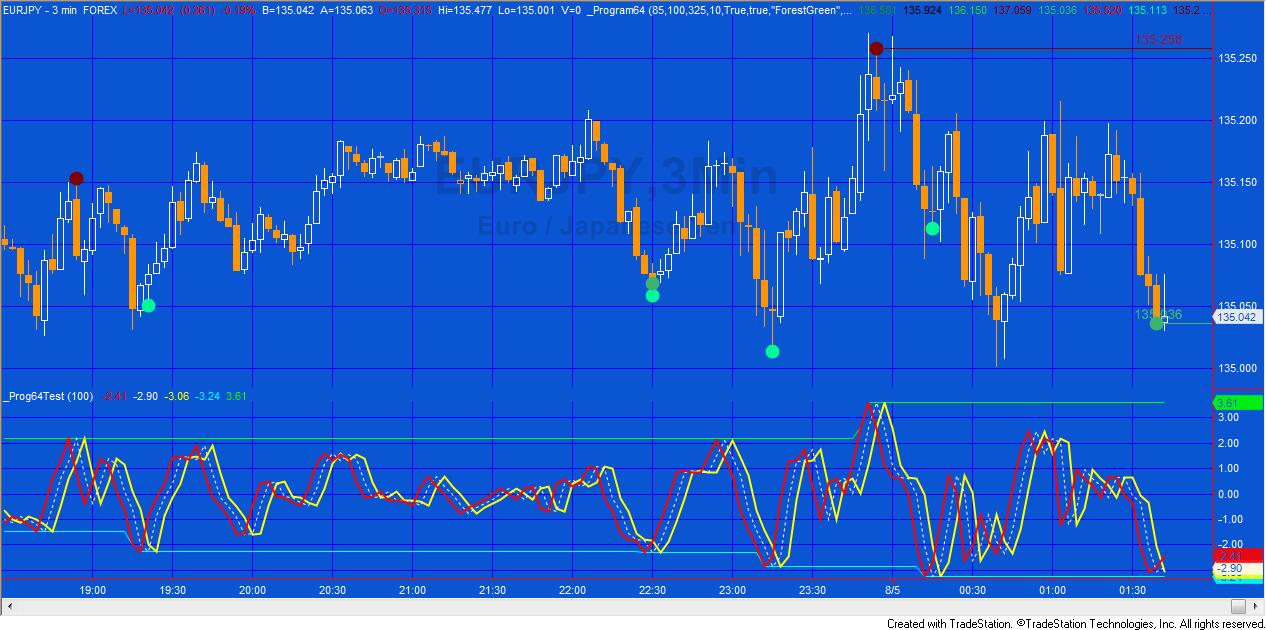
This new program is based on the same ideas found in program 21 but has extra features. The unprotected program is now available for download. This means that you can examine the code and modify it (if you wish).
Program 64 uses four different ways to find turning points: type 1, type 2, type 3, and type 4. I provide more information about the methodologies in a bonus video included with the download. When a turning point is found, a dot is plotted on the chart. If several conditions apply on the same bar the plots are separated by the value of the Spacer input multiplied by the tick value. If the Alerts input is set to true, alerts are generated when each turning point occurs.
The program also draws lines at the level of the last high and the last low turning point.
Find more information about the program here.
After purchase you will be redirected to a download page, so don’t close the browser. You will also receive an automated email with the dowload link and instructions for accessing the bonuses.
If you are a Gold Pass member make sure you enter the special coupon code to get 20% discount off these prices.
Program 65 | Zig zag function with Fibonacci detection
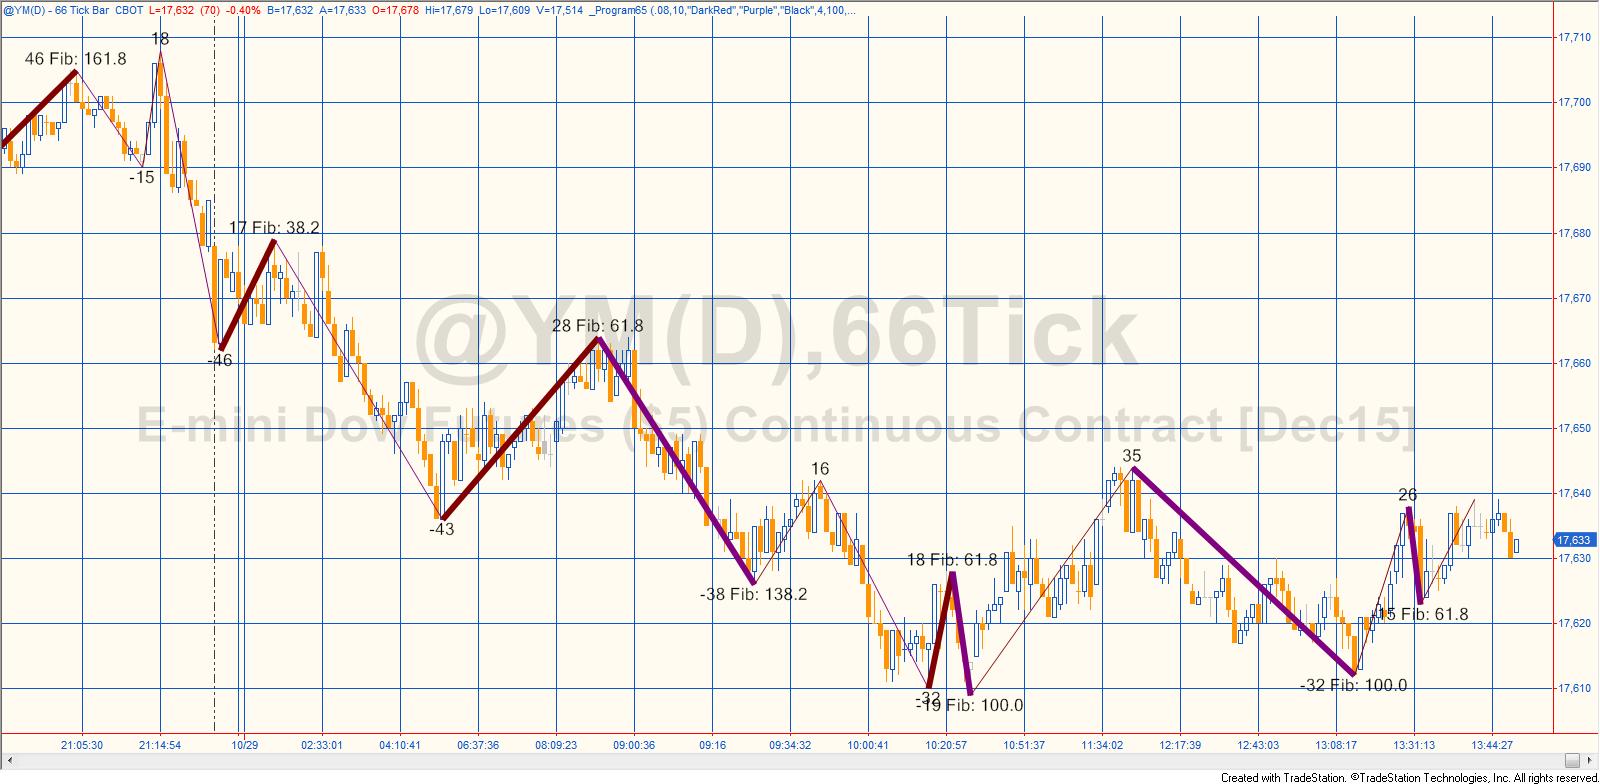
Program 65 consists of a new zig zag function and a companion show me study that demonstrates how to call the function. Both programs are included in the download.
When the function is called it calculates and draws zig zag lines on the chart together with text at the zig zag pivots. The text shows the vertical height of each zig zag leg. If the vertical ratio of two most recent zig zag lines is close to a Fibonacci ratio, text is also displayed to show which Fibonacci ratio it is close to and the zig zag line is drawn with a heavier weight.
Both Fibonacci retracements and extensions (projections) are looked for.
Program 66 | Flexible divergence function

Program 66 is a TradeStation function developed using EasyLanguage designed to look for potential divergences between price and one of the following oscillators:
- Stochastic
- Relative Strength Index (RSI)
- True Strength Index (TSI)
- Commodity Channel Index (CCI)
- Moving Average Convergence/Divergence (MACD)
- Stochastic of RSI
The function, written for TradeStation 9.5 (and is compatible with versions 9.0, 9.1, 9.5, 10.0 and above), works with volume, second, tick, kagi, Kase, line break, momentum, point and figure, range, renko charts and can be called from indicators, show me studies, strategies and paint bar studies.
Program 67 | Fibonacci retracements based on historic zigzag moves
Program 67 is a TradeStation EasyLanguage ShowMe study that:
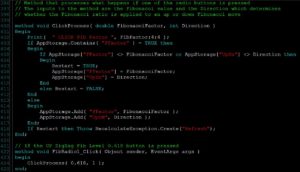 Calculates and displays zig zag moves
- Displays a visual signal that two consecutive up or down zig zag moves are equal or nearly equal to each other
- Calculates either 38.2%, 61.8%, or 100% retracements based on either up zig zags or down zig zags (user selectable using the form). A horizontal line is drawn at this level
- Horizontal lines are stored in a vector and their alpha value is decreased as more zig zag lines are added, so the newer lines are ‘brighter’
- The selection of which Fib level to use to determined using a form with radio buttons
- Clicking a radio button stores the values selected in AppStorage and issues a recalculate exception

Program 68 | Heikin-Ashi bars with candlestick patterns and congestion indicators
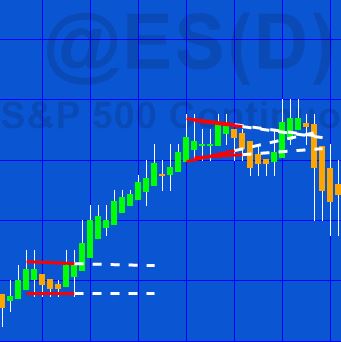
Program 68 consists of a TradeStation EasyLanguage indicator (_Program 68 Markplex Heikin Ashi) and a function (_Program68LinearRegression) designed for use with charts that:
- Calculate and display the Heikin-Ashi candlesticks (using an indicator and plot statements)
- Look for and displays areas of consolidation (that may precede price expansion)
- Search for and display the following candlestick patterns:
- Doji
- 3 White Soldiers/ 3 Black Crows
- Bullish and bearish Haramis
- Hammer or Hanging man
Heikin-Ashi candlesticks attempt to remove noise from price data to make it easier to see price direction. This program calculates and displays Heikin-Ashi candlesticks, various candlestick patterns and indicates price congestion.
Click here to go to the program page for more information.
After purchase you will be redirected to a download page, so don’t close the browser.
Program 69 | Markplex Ichimoku Cloud Collection

The Ichimoku Cloud has many applications including:
- Determining trend direction
- Determining trend momentum
- Support and resistance
- Giving potential signals
The Markplex Ichimoku Cloud Collection consists of three TradeStation EasyLanguage programs:
- _Ichimoku – an indicator that plots the Ichimoku lines and the cloud.
- _IchimokuPB – a paint bar study that varies bar color depending on where price is in relation to the cloud, whether Leading Span A is above or below Leading Span B and when the close crosses out of the cloud.
- _IchimokuSM – a show me study that plots when it detects support of resistance in the cloud, when the conversion line crosses the base line, when price crosses base line, when price moves above or below the cloud, and when the cloud changes color.
See the program 69 page for more information.
After purchase you will be redirected to a download page, so don’t close the browser.
Program 70 | Flexible Zig zag functions with Fibonacci detection option

Program 70 consists of two functions and three demonstration show me studies that call one or the other function. These new functions allow a user to build zig zags from a calculated series, such as a moving average (Zig zags on this site have, thus far, been built using high price pivots and low price pivots. These new functions allow you to replace using price high and price low with other calculated values.)
The two functions, _ZigZagDisplay and _ZigZag, include the same core zig zag functionality, but the _ZigZag function also includes algorithms to detect whether ratios of the price increase/decrease consecutive zig zags are equal to (or close to) a Fibonacci ratio.
Go the program 70 page for more information or to download the programs.
Program 71 | Analysis of multiple time frame averages
See the program page for more information.
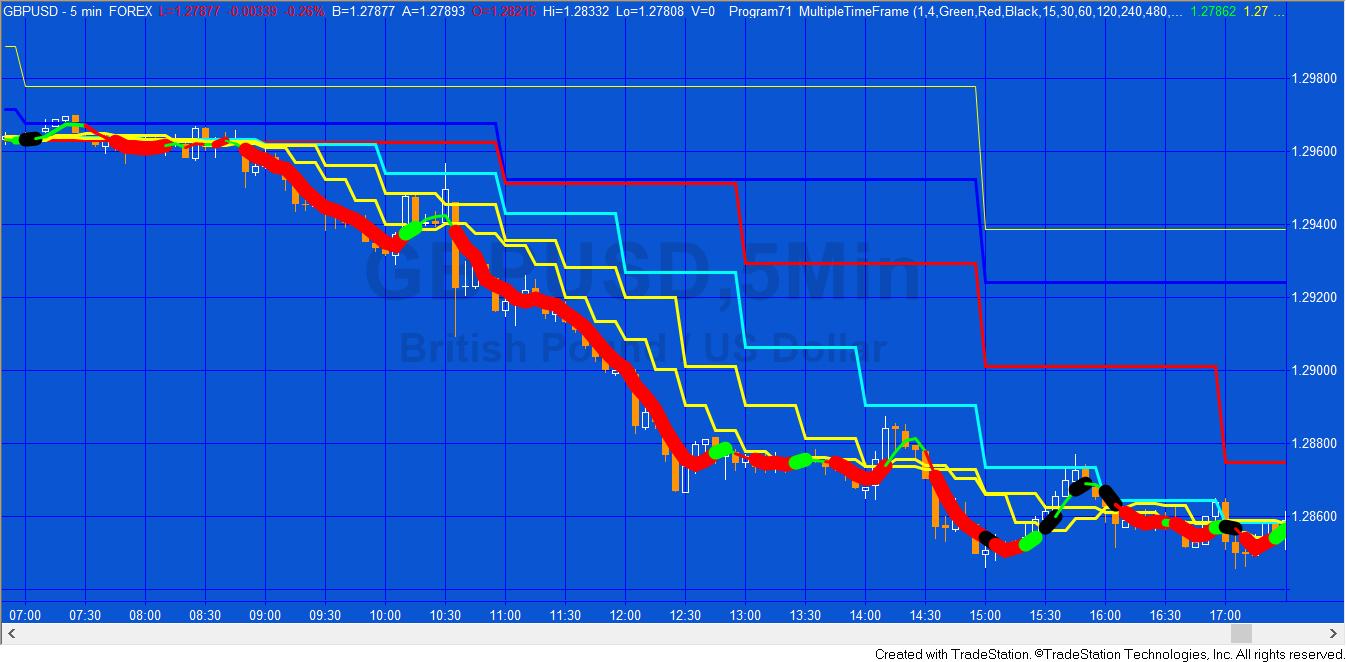
Program 71 changes the color and thickness of the simple average of price to indicate a bearish, or bullish bias or congestion based on analysis of several time series moving averages and their position relative to each other. The program is unprotected and available for immediate download so that you can modify it to your own needs.
Program 71 uses the Price Series Provider class to calculate and plot simple moving averages for 6 different user specified time series. The intervals for the time series are specified in minutes, for example program 71’s defaults are: 15 minutes, 30 minutes, 60 minutes, 120 minutes, 240 minutes, and 480 minutes. Simple moving averages are calculated for the symbol on the chart (I have used a 5 minute interval for most of the examples on this page) as well as for the time series and these are plotted on the chart.
Program 72 | PivotTester
 Program 72 includes two programs that look for high and low pivots. Each time a pivot is found it is compared with previous pivots. If it is not within a user defined price from a previous pivot a new horizontal pivot line is drawn which is extended to the right of the chart. If the new pivot IS within a user defined price from a previous pivot the thickness of the existing horizontal line is increased (up to a maximum value). If the price crosses a pivot line, that line is discontinued. The color of the lines is determined by whether they were drawn for a low pivot or a high pivot.
 The possible implication is that a thicker line represents a ‘strong’ support or resistance, and once broken might suggest a break-out from a trading range.
_P72PivotTester is available for free download by Gold Pass members.
Program 73 | Bollinger squeeze function (and strategy)
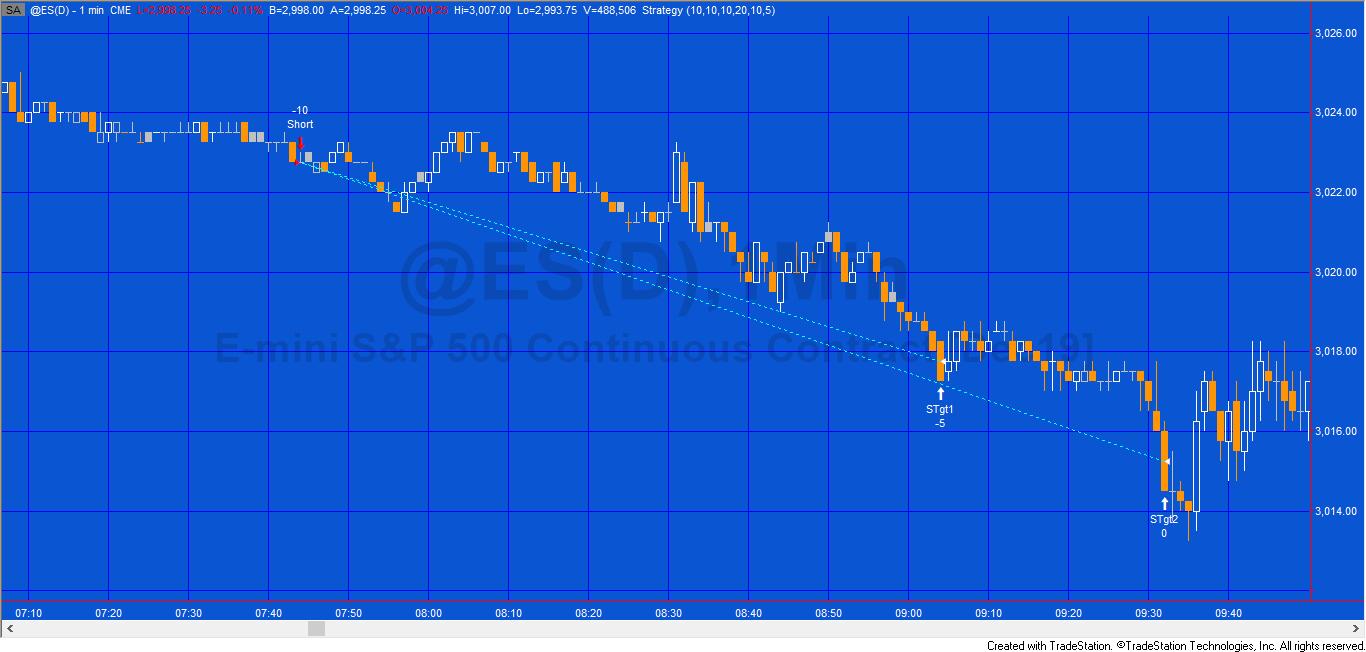
See the program 73 program page for more information and a video.
Program 73 consists of a a function that calculates the Bollinger squeeze and returns an integer value of the number of bars after the last squeeze occurred. A companion breakout strategy is also includes that uses the function.
Both programs work in TradeStation and MultiCharts and are available for immediate download.
Program 74 | Convergent Fibonacci levels from lines drawn with the drawing tool

Program 74 allows a user to draw trend lines on a chart for which Fibonacci levels are calculated and drawn. Program 74 then calculates when the Fibonacci levels (horizontal lines) relating to the drawn lines are ‘convergent’ (close to each other according to a user input). The convergent lines a drawn on the chart and their levels are stored in the Global Variable DLL. A separate receiver program draws lines on other charts.
Note that the program 74 package was developed for TradeStation 9.5 and above and is not compatible with MultiCharts.
Program 74 | Convergent Fibonacci levels from lines drawn with the drawing tool | GlobalDictionary Edition
 Program 74 GlobalDictionary Edition (_Program74_GDictVer) allows a user to draw trend lines on a chart with the drawing tools, for which Fibonacci retracement levels are automatically calculated and drawn. As new trend lines are added, _Program74_GDictVer calculates when the Fibonacci levels (horizontal lines) relating to the drawn lines are ‘convergent’ (close to each other according to a user input). The convergent lines are drawn on the chart and their price levels are stored in the GlobalDictionary.
A separate receiver program (_Program74_GDictVer_Rec) reads the information from the GlobalDictionary and draws lines on charts where it is inserted.
The ‘sending’ and ‘receiving’ programs are coordinated by the use of an input: UniqueName. This means that, so long as different UniqueName values are used, it is possible to have several different sending and receiving charts. It is also possible to have a sending chart ‘sending’ levels data to two ‘receiving’ charts.
Visit the program page here.
Program 75 | Raff linear regression channel
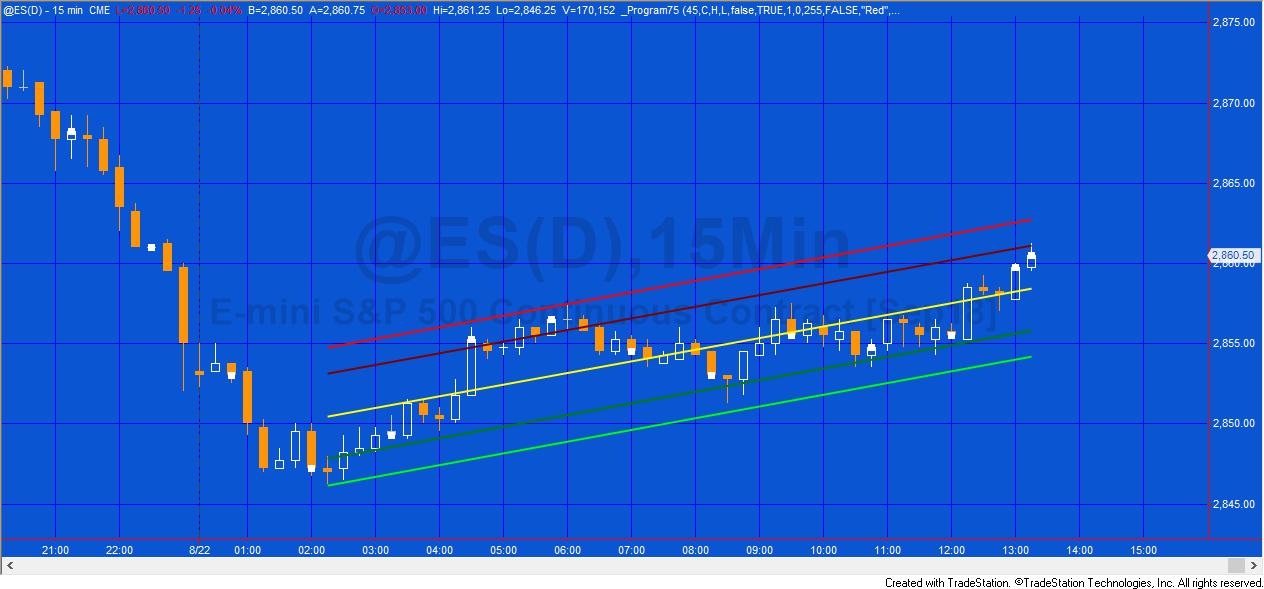
Program 75 is a TradeStation EasyLanguage indicator that plots and draws a Raff linear regression channel.
A Raff linear regression channel bases the height of the channel on the price that is furthest away from the linear regression line in the channel. The program also allows the user to create a channel that ends at a specific bar, by clicking on that bar. The program detects the bar click and redraws the channel.
This program does not work with MultiCharts.
Program 75 was developed for TradeStation 9.5 and above and is not compatible with MultiCharts because of the objects used.
After purchase you will be redirected to a download page, so don’t close the browser. You will also receive an automated email with the download link and instructions for accessing the bonuses.
Program 76 | Calculate and transfer Fibonacci levels using XML
 Program 76 consists of two show me studies. The ‘sender’ study (_Program76-XML-Sender) calculates Fibonacci and extension levels based on a manually drawn trend line (between two pivots, for example). These Fibonacci levels are stored in an XML file and saved to a hard drive. The ‘receiver’ study (_Program76-XML-Receiver) queries the XML file, retrieves the levels and draws them on the receiver chart or charts.
After purchase you will be redirected to a download page, so don’t close the browser. You will also receive an automated email with the download link and instructions for accessing the bonuses.
Program 77 | Bar-run show me with bar profile chart creator
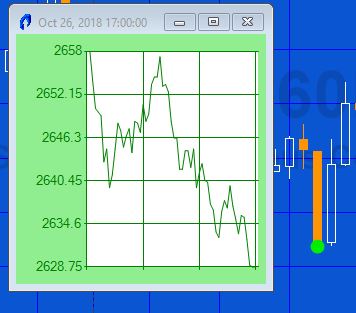
A Gold Pass member asked me how he could go about creating a program that showed when a ‘bar-run’ occurred. He defined a bar-run as being an unusually long down bar that closed near its low or an unusually long bar that closed near its high.
It is easy to create a program to do this (I have included a free example of such a program in the Gold Pass section of the program page), but it made me think that the price moves following a bar-run might also be dependent on the ‘shape’ or profile of the price move within the bar-run bar.
Program 77 (_Program77_BarRun) displays a bar price profile to the minute level (i.e. for a 30 minute bar you will see 30 data points).
When it is first applied to a chart the profile of the last bar is displayed. The color of the profile chart is dependent on whether it is a bar-run chart up, a bar-run chart down, or not a bar-run chart. The date and time of the bar are displayed at the top of the form.
When subsequent bars are clicked their profiles are plotted and the color of the profile chart is set to green for a down ‘bar run’ bar, red for an up ‘bar run’ bar, and blue for a bar that is neither a bar run up or down bar. The date and time of the bar clicked are displayed at the top of the form.
Program 78 | Analysis of volume at chart price levels
 Program 78 estimates horizontal support and resistance lines based on the chart’s volume profile. The theory underlying program 78 is that if significant volume has occurred at a specific price level then that level may have some significance as an area of support and/or resistance. Unlike program 56 which analyzes all the bars on a chart (after maxbarsback bars), program 78 only analyzes a user defined number of bars starting from the last completed bar on the chart and counting backwards.
Program 78 (Send Data Version) | Communicate program 78 levels to another chart
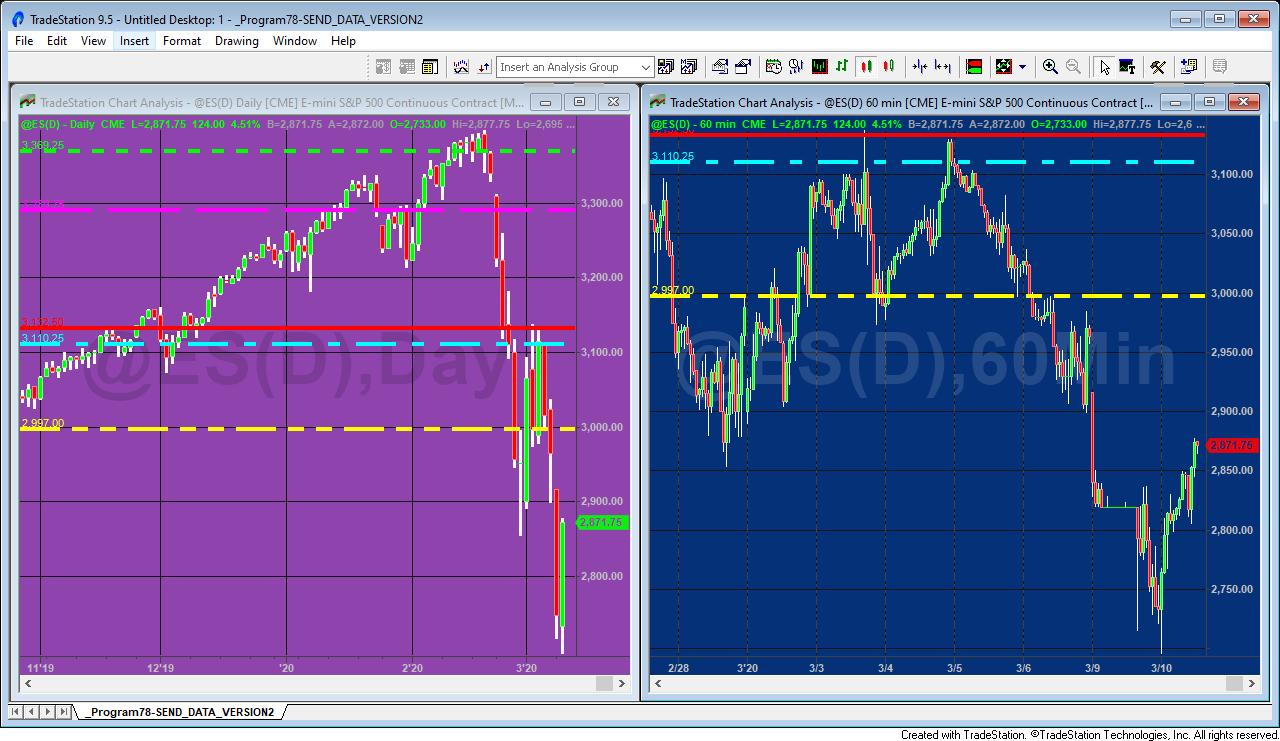

Based on program 78, Program 78 SEND DATA VERSION (Program 78 SDV) estimates horizontal support and resistance lines based on the chart’s volume profile. The theory underlying Program 78 SDV is that if significant volume has occurred at a specific price level then that level might have some significance as an area of support and/or resistance.
Program 78 SDV uses a Global Dictionary to provide the chart price levels (and color and style preferences) to another chart. In addition Program 78 SDV has been modified to use the HorizontalLine class rather than TrendLines and Drawing objects. This has the added advantage of the program being simplified and easier to understand. The other functionality is almost identical to program 78.
Program 78 SDV is packaged with _Program78-READ_DATA_VERSION (Program78 RDV). This companion program reads the levels information from the Global Dictionary and draws the lines on a different chart.
For downloads and more information visit the program 78 SDV page.
Program 79 | Analysis of volume at chart price levels for the last week
 Program 79 estimates horizontal support and resistance lines based on the chart’s volume profile for the previous week.
The theory underlying program 79 is that if significant volume has occurred at a specific price level then, perhaps, that level have some significance as a level of support and/or resistance.
Program 80 | Bid/ask trade analyser
 Program 80 uses a Time and Sales provider to analyze trade information. Trade data is stored in vectors and the following two calculations are made:
FIVE PERCENT VOLUME RATIO CALCULATION
On the closing tick of each bar an analysis of the vectors is made of the trades with the top five percent of size divided by the total volume for a bar. This is calculated for all trades, for trades at ask price, and for trades at bid price. The calculation is done using the AnalyzeVector method. A plot is made of these values. The negative value of the trades at ask price ratio is plotted.
LARGEST TRADE SIZE CALCULATION
Since all the trades are already sorted in the vector by size, it is a trivial matter to find the largest trade size by retrieving the value stored in the zero position of the respective vectors. This is done using the AnalyzeVector method. This is done on the last tick of the bar and the values are plotted. The negative value of the largest trade ask price is plotted.
Program 81 | Frequency of trades, bids, and asks
 Program 81 uses a time and sales provider to analyze trade information and plot the number of trades, asks, and bids per bar.
In program 81 the number of trades and bids are plotted as positive numbers, the number of asks as a negative number. Time and Sales data is not available historically in TradeStation so program 81 stores and retrieves calculated values to and from a text file on the user’s hard drive using Streamwriter and Streamreader (the name and location of the file being defined by a user input).
For downloads and more information visit the program 81 page.
Program 82 | Automatically syncing/replicating drawing objects on other charts
For downloads and more information visit the program 82 page.
Program 82 is designed to enable a user to manually create drawing objects (rectangles, trendlines, horizontal lines, vertical lines, text, and ellipses) on a chart and for these drawing objects to be created automatically on other charts.
If an object is subsequently moved on the sending chart, it is automatically moved on the receiving chart. If an object’s attributes (e.g. size, color, style, pattern, fill etc) are changed on the sending chart these same attributes are changed on the receiving chart(s).
Please note that any screen shots on this site are examples and are not meant to imply that any of these programs will generate profitable trades.
Program 83 | Sum of stochastic, RSI, TSI, CCI, MACD, and stochastic of RSI divergences
For downloads and more information visit the program 83 page.
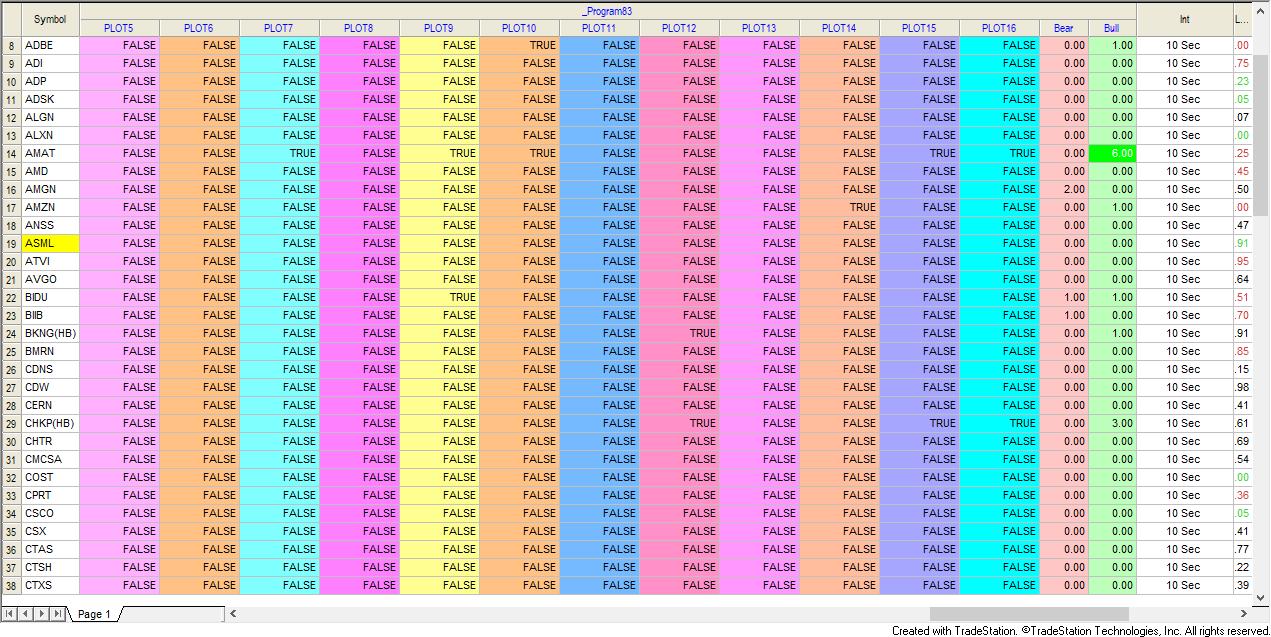 _Program 83, designed for TradeStation RadarScreen and Scanner, looks for regular bullish and bearish divergences between a price and each of sixteen oscillators. The number of oscillators for which there is bullish divergence for each bar is summed. The number of oscillators for which there is bearish divergence is also summed and the two sums are plotted in Radarscreen and available within TradeStation Scanner.
The download includes a companion program, _Program83-tester (based on program 62) provides additional useful functionality including checking if a divergence with a specific oscillator has occurred. It can also be used to give a visual indication of a divergence on a chart for a specific oscillator.
Program 84 | Support and Resistance Lines based on Pivots in PSP
 Program84-HorizLine creates horizontal support and resistance lines based on the record of levels of previous pivots. The program is similar to program 55 but instead of looking for pivots in the bars of the current chart, it uses a price series provider to search for pivots in a different bar interval. The idea behind the program is that if pivots have occurred at a specific level before, then that price level may have some significance, especially if they have occurred at the same level (or near to the same level) on several occasions before.
Program 85 | Strategy component using Support and Resistance Lines based on Pivots
 This site contains several tutorials and programs that create horizontal support and resistance lines based on the levels of previous pivots. These are summarized in tutorial 123.
The idea behind these programs is that if pivots have occurred at a specific level before then that price level may have some significance, especially if they have occurred at the same level (or near to the same level) on several occasions before.
This new strategy component, program 85, shows a way of building this idea into a strategy component.
The tutorial program is not compatible with MultiCharts as it makes extensive use of objects.
Program 86 | Recurring volume profile for a user specified time period
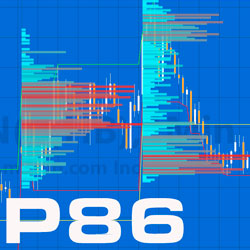 Program 86 uses the Price Series Provider class to create a volume profile for specified periods during the day starting at a user input time and for subsequent days, the beginning of the day . The length of this period is determined by a user input: RepeatTime. When this time elapses the volume profile is calculated and drawn. Data collection then starts for the next recurring period. This is repeated throughout the day. The profile is color coded between 2 user specified colors: HistColor1 and HistColor2.
Note: Because the drawing tool used in this program can only draw to specific bars, the lengths of the profile are an approximation.
Having calculated the volume profile, Program 86 then calculates at which price level most volume occurred during the period being analyzed.
The tutorial is NOT compatible with MultiCharts.
Program 87 | Recurring volume profile (with end-of-bar real time update)
THESE INDICATORS, SHOW ME STUDIES, STRATEGY COMPONENTS AND OTHER PROGRAMS HAVE BEEN INCLUDED SOLELY FOR EDUCATIONAL PURPOSES.
TO THE BEST OF MARKPLEX CORPORATION’S KNOWLEDGE, ALL OF THE INFORMATION ON THIS PAGE IS CORRECT, AND IT IS PROVIDED IN THE HOPE THAT IT WILL BE USEFUL. HOWEVER, MARKPLEX CORPORATION ASSUMES NO LIABILITY FOR ANY DAMAGES, DIRECT OR OTHERWISE, RESULTING FROM THE USE OF THIS INFORMATION AND/OR PROGRAM(S) DESCRIBED, AND NO WARRANTY IS MADE REGARDING ITS ACCURACY OR COMPLETENESS. USE OF THIS INFORMATION AND/OR PROGRAMS DESCRIBED IS AT YOUR OWN RISK.
ANY EASYLANGUAGE OR POWERLANGUAGE TRADING STRATEGIES, SIGNALS, STUDIES, INDICATORS, SHOWME STUDIES, PAINTBAR STUDIES, PROBABILITYMAP STUDIES, ACTIVITYBAR STUDIES, FUNCTIONS (AND PARTS THEREOF) AND ASSOCIATED TECHNIQUES REFERRED TO, INCLUDED IN OR ATTACHED TO THIS TUTORIAL OR PROGRAM DESCRIPTION ARE EXAMPLES ONLY, AND HAVE BEEN INCLUDED SOLELY FOR EDUCATIONAL PURPOSES. MARKPLEX CORPORATION. DOES NOT RECOMMEND THAT YOU USE ANY SUCH TRADING STRATEGIES, SIGNALS, STUDIES, INDICATORS, SHOWME STUDIES, PAINTBAR STUDIES, PROBABILITYMAP STUDIES, ACTIVITYBAR STUDIES, FUNCTIONS (OR ANY PARTS THEREOF) OR TECHNIQUES. THE USE OF ANY SUCH TRADING STRATEGIES, SIGNALS, STUDIES, INDICATORS, SHOWME STUDIES, PAINTBAR STUDIES, PROBABILITYMAP STUDIES, ACTIVITYBAR STUDIES, FUNCTIONS AND TECHNIQUES DOES NOT GUARANTEE THAT YOU WILL MAKE PROFITS, INCREASE PROFITS, OR MINIMIZE LOSSES.