NOTE: You may be interested in a new version of this program that includes the capability of replacing the text on the chart with show me dots as well as couple of other modifications. See Program 25 (with plots) for more information.
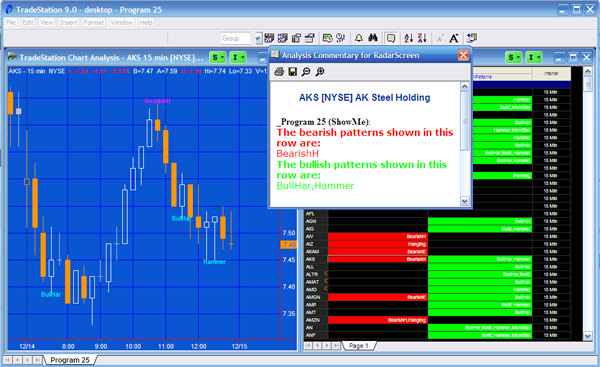
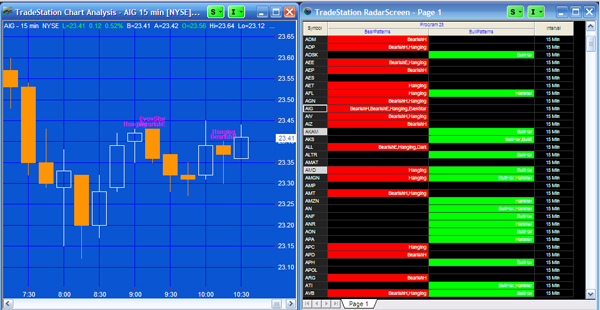
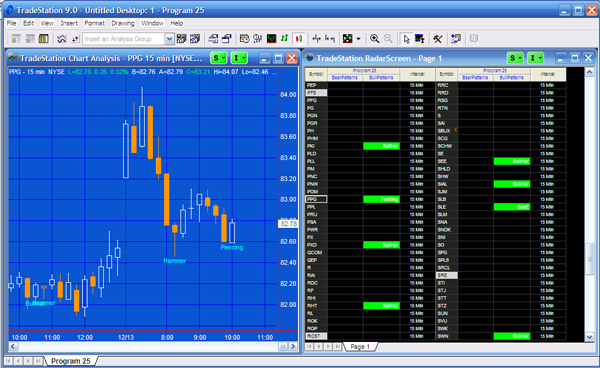
Program 25 is a show me study that searches for candlestick patterns on both charts and RadarScreen.
This UNPROTECTED program (i.e. the TradeStation EasyLanguage show me study) is available for immediate download for $59.95 by clicking the ‘add to cart’ button to pay using Credit card or PayPal. The download includes the unprotected functions used by the program: _CheckLastSeveral and _PatternCommentary together with plain text version of program 25 and the two functions.
The programs work in TradeStation 9.0 and above, on intraday, daily, weekly, and monthly charts. The show me study may be applied to tick charts, but the pattern text may not display correctly due to the legacy EasyLanguage drawing tool limitations.
When you apply the program to RadarScreen, please make sure that you click “Load Additional Data for Accumulative Calculations.” Also set “additional Bars to Load.” In the video I set this to 100.
The patterns looked for are:
- 3 White Soldiers
- 3 Black Crows
- Bullish Harami
- Bearish Harami
- Bullish Engulfing
- Bearish Engulfing
- Hammer
- Hanging Man
- Morning Doji Star
- Evening Doji Star
- Morning Star
- Evening Star
- Piercing Line
- Dark Cloud
- Shooting Star
In each case you can determine whether to search for particular patterns by setting a user input (1 = yes, 0 = no)–see the inputs below. The program works in RadarScreen, where you have the option of seeing if a patterns has occurred on the current ‘bar’ or whether one has appeared within a user input number of bars. I explain this in more detail in the video lower down the page.
This UNPROTECTED program (i.e. the TradeStation EasyLanguage show me study) is available for immediate download for $59.95 by clicking the ‘add to cart’ button to pay using Credit card or PayPal. The download includes the unprotected functions used by the program: _CheckLastSeveral and _PatternCommentary together with plain text version of program 25 and the two functions..
The programs were developed in TradeStation 9.0 and work on intraday, daily, weekly, and monthly charts. The show me study may be applied to tick charts, but the pattern text may not display correctly due to an EasyLanguage drawing limitation.
Stochastic filter
The program includes an optional Stochastic filter. If the user input StochFilter is set to TRUE the program only shows potentially ‘bullish’ patterns if oSlowK <= 20 and only shows potentially ‘bearish’ patterns if oSlowK >= 80.
Commentary
If you enable the commentary capability in RadarScreen, you will also see a summary of candlestick patterns in the row that you clicked, similar to the following image:
Alerts
Alerts are also set up for both charts and RadarScreen. When you enable Alerts then you will be alerted each time a pattern occurs. Your alert settings will determine how the alert is presented.
User inputs
LastBar( 0), // If ShowMe study is applied to RadarScreen LastBar is the number of bars to ‘look back’
Length( 14), // Input to various Candlestick pattern functions
Percent( 5), // Input to various Candlestick pattern functions
ADJ(0.0003), // Determines position of text
Factor( 2), // Input to various Candlestick pattern functions
StochFilter( FALSE) , // Determines if Stochastic filter is applied
Use3WhiteSoldiers( 1), // Use this Candlestick pattern (1 = yes, 0 = no)
Use3BlackCrows( 1), // Use this Candlestick pattern (1 = yes, 0 = no)
UseBullishHarami( 1), // Use this Candlestick pattern (1 = yes, 0 = no)
UseBearishHarami( 1), // Use this Candlestick pattern (1 = yes, 0 = no)
UseBullishEngulfing( 1), // Use this Candlestick pattern (1 = yes, 0 = no)
UseBearishEngulfing( 1), // Use this Candlestick pattern (1 = yes, 0 = no)
UseHammer( 1), // Use this Candlestick pattern (1 = yes, 0 = no)
UseHangingMan( 1), // Use this Candlestick pattern (1 = yes, 0 = no)
UseMorningDojiStar( 1), // Use this Candlestick pattern (1 = yes, 0 = no)
UseEveningDojiStar( 1), // Use this Candlestick pattern (1 = yes, 0 = no)
UseMorningStar( 1), // Use this Candlestick pattern (1 = yes, 0 = no)
UseEveningStar( 1), // Use this Candlestick pattern (1 = yes, 0 = no)
UsePiercingLine( 1), // Use this Candlestick pattern (1 = yes, 0 = no)
UseDarkCloud( 1), // Use this Candlestick pattern (1 = yes, 0 = no)
UseShootingStar( 1); // Use shooting star (1 = yes, 0 = no)
Explanation of candlestick pattern inputs
For all the candlestick patterns calculated in this program Length is used to calculate the average body.
For Use3WhiteSoldiers and Use3BlackCrowsThreshold, Percent is the proximity percent of the close to the high or low.
For ShootingStar, UseHammer, or UseHangingMan, the shadow or tail must be greater than Factor multiplied by body size.
For UseMorningDojiStar or UseEveningDojiStar, Percent is the Doji threshold for the (open – close) as a percent of the range of the bar.
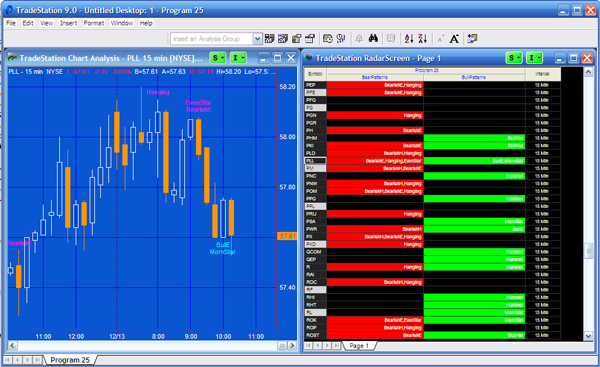
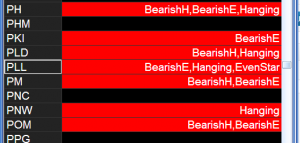
If a pattern occurs more than once within user input LastBar bars then its name is only displayed once in the RadarScreen cell. For example, in the image on the right the following patterns are shown as occurring within the last eleven bars (i.e. the LastBar input is set to 10 plus the current bar = 11) for symbol PLL: Bearish Engulfing, Hanging and Evening Star. Had one of these patterns occurred more than once, its name would only be displayed once in the cell.
The program makes use of TradeStation 9.0 method and TokenList functionality and has been tested on monthly, weekly, daily, intraday, and tick charts (although on lower value tick charts the limitations of the TradeStation drawing functionality may result in the text being drawn on an incorrect bar).
The video below describes these features in more detail.
Program 25 | Candlestick program applied to a chart and RadarScreen
Video Demonstration of TokenList and Example Program
In the following video and example program I demonstrate how to use the TradeStation 9.0 TokenList class. This video is available exclusively to Gold Pass members (if you are a Gold Pass member, please make sure you are logged in to be able to see the video).![]() This content is for members only.
This content is for members only.
TO THE BEST OF MARKPLEX CORPORATION’S KNOWLEDGE, ALL OF THE INFORMATION ON THIS PAGE IS CORRECT, AND IT IS PROVIDED IN THE HOPE THAT IT WILL BE USEFUL. HOWEVER, MARKPLEX CORPORATION ASSUMES NO LIABILITY FOR ANY DAMAGES, DIRECT OR OTHERWISE, RESULTING FROM THE USE OF THIS INFORMATION AND/OR PROGRAM(S) DESCRIBED, AND NO WARRANTY IS MADE REGARDING ITS ACCURACY OR COMPLETENESS. USE OF THIS INFORMATION AND/OR PROGRAMS DESCRIBED IS AT YOUR OWN RISK.
ANY EASYLANGUAGE OR POWERLANGUAGE TRADING STRATEGIES, SIGNALS, STUDIES, INDICATORS, SHOWME STUDIES, PAINTBAR STUDIES, PROBABILITYMAP STUDIES, ACTIVITYBAR STUDIES, FUNCTIONS (AND PARTS THEREOF) AND ASSOCIATED TECHNIQUES REFERRED TO, INCLUDED IN OR ATTACHED TO THIS TUTORIAL OR PROGRAM DESCRIPTION ARE EXAMPLES ONLY, AND HAVE BEEN INCLUDED SOLELY FOR EDUCATIONAL PURPOSES. MARKPLEX CORPORATION. DOES NOT RECOMMEND THAT YOU USE ANY SUCH TRADING STRATEGIES, SIGNALS, STUDIES, INDICATORS, SHOWME STUDIES, PAINTBAR STUDIES, PROBABILITYMAP STUDIES, ACTIVITYBAR STUDIES, FUNCTIONS (OR ANY PARTS THEREOF) OR TECHNIQUES. THE USE OF ANY SUCH TRADING STRATEGIES, SIGNALS, STUDIES, INDICATORS, SHOWME STUDIES, PAINTBAR STUDIES, PROBABILITYMAP STUDIES, ACTIVITYBAR STUDIES, FUNCTIONS AND TECHNIQUES DOES NOT GUARANTEE THAT YOU WILL MAKE PROFITS, INCREASE PROFITS, OR MINIMIZE LOSSES.
This UNPROTECTED program (i.e. the TradeStation EasyLanguage show me study) is available for immediate download for $59.95 by clicking the ‘add to cart’ button to pay using Credit card or PayPal. The download includes the unprotected functions used by the program: _CheckLastSeveral and _PatternCommentary together with plain text version of program 25 and the two functions..
The programs works in TradeStation 9.0 and above, in intraday, daily, weekly, and monthly charts. The show me study may be applied to tick charts, but the pattern text may not display correctly due to an EasyLanguage drawing limitation.

