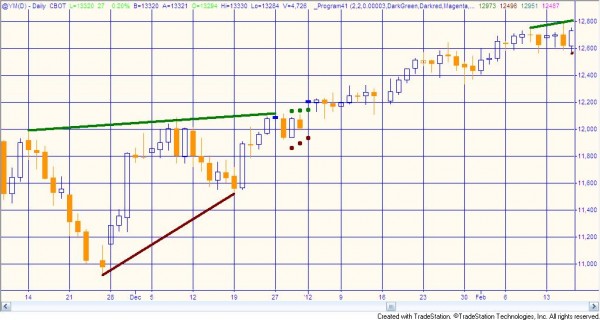
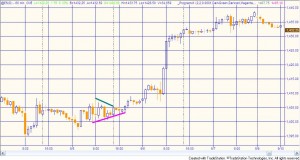
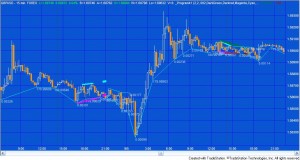
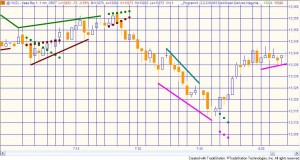
Program 41 is designed to search for ‘price congestion’ on a chart. See the video below for more information.

It works by searching for high pivots and storing the bar number at which they occurred in an array. Each time a new high pivot is confirmed, the program checks to see if a line can be drawn that is ‘close’ to going through the three most recent pivot points. If it finds such a line the program then searches to see if two low pivots have occurred after the oldest high pivot. If so the program draws a line connecting the most recent and the third most recent high pivots and the two most recent low pivots, provided the lines are converging.

Similarly, program 41 searches for low pivots, storing the bar number at which they occurred in an array. Each time a new low pivot is confirmed, the program checks to see if a line can be drawn that is ‘close’ to going through the three most recent low pivot points. If it finds such a line the program then searches to see if two high pivots have occurred after the oldest low pivot. If so the program draws a line connecting the most recent and the third most recent low pivots and the two most recent high pivots, provided the lines are converging.

Once these lines are drawn the program starts plotting showme dots to continue the lines to the right. Once price breaches the lines (plus a user input number of ticks, in the case of high lines, or minus a user input number of ticks, in the case of low lines. This user input is specified by the TickTol input–see below) the program plots one more dot and then ceases to continue plotting dots to show the user that the line has been breached.
Determining whether 3 pivot points are approximately in a straight line
In the following image 3 high pivots can be seen. Angles A and B are measured and the difference between them calculated. For the line joining the first and third pivot, the absolute value of the difference between the two angles must be less than the user input: MaxAllowedAngleDiff.

Be aware that the angle is often very different from how it appears on the chart. To determine an appropriate value for MaxAllowedAngleDiff, I suggest, initially setting it to a large value, then set the Debug user inut to TRUE and view the calculated angles in the print log. You will see output like the following:
1120911.00 1330.00 GBPUSD Angle1 – Angle2 0.0007646932
1120911.00 1330.00 GBPUSD Angle1 – Angle2 0.0007646932
1120911.00 1330.00 GBPUSD Angle1 – Angle2 0.0007646932
1120911.00 1330.00 GBPUSD Angle1 – Angle2 0.0007646932
1120911.00 1330.00 GBPUSD Angle1 – Angle2 0.0007646932

The UNPROTECTED program (i.e. TradeStation EasyLanguage indicator) DEVELOPED IN VERSION 9.0 of TradeStation are available for immediate download for $69.95. Click the ‘add to cart’ button to pay using Credit card or PayPal. Gold Pass members are eligible for 20% off this price when they type in their special discount code (see //markplex.com/gold-pass-content/ to get the latest code).
Introduction to program 41 video
Program 41 bonus video (password protected–password available with download)
The UNPROTECTED program (i.e. TradeStation EasyLanguage indicator) DEVELOPED IN VERSION 9.0 of TradeStation are available for immediate download for $69.95. Click the ‘add to cart’ button to pay using Credit card or PayPal. Gold Pass members are eligible for 20% off this price when they type in their special discount code (see //markplex.com/gold-pass-content/ to get the latest code).
User Inputs
LeftStrength( 2 ), // Left strength of price pivots
RightStrength( 2 ), // Right strength of price pivots
MaxAllowedAngleDiff( 5 ), // Maximum slope angle for lines to be considered close enough to join 3 pivots
LineColor1( DarkGreen ), // Upper line ‘joining’ 3 high pivots
LineColor2( Darkred ), // Lower line joining 2 low pivots that have occurred between 1st and 3rd high pivots
LineColor3( Magenta ), // Upper line joining 2 high pivots that have occurred between 1st and 3rd low pivots
LineColor4( Cyan ), // Lower line ‘joining’ 3 low pivots
TickTol( 5 ), // Price must break out above or below projected lines for showme dots to cease to be drawn
Debug( True );
The UNPROTECTED program (i.e. TradeStation EasyLanguage indicator) DEVELOPED IN VERSION 9.0 of TradeStation are available for immediate download for $69.95. Click the ‘add to cart’ button to pay using Credit card or PayPal. Gold Pass members are eligible for 20% off this price when they type in their special discount code (see //markplex.com/gold-pass-content/ to get the latest code).
Program overview for Gold Pass members
If you are are a Gold Pass member, make sure you are logged in to see the following content:
![]() This content is for members only.
This content is for members only.
Please note that any screen shots on this site are examples and are not meant to imply that any of these programs will generate profitable trades. THESE INDICATORS, SHOW ME STUDIES, STRATEGIES AND OTHER PROGRAMS HAVE BEEN INCLUDED SOLELY FOR EDUCATIONAL PURPOSES.
TO THE BEST OF MARKPLEX CORPORATION’S KNOWLEDGE, ALL OF THE INFORMATION ON THIS PAGE IS CORRECT, AND IT IS PROVIDED IN THE HOPE THAT IT WILL BE USEFUL. HOWEVER, MARKPLEX CORPORATION ASSUMES NO LIABILITY FOR ANY DAMAGES, DIRECT OR OTHERWISE, RESULTING FROM THE USE OF THIS INFORMATION AND/OR PROGRAM(S) DESCRIBED, AND NO WARRANTY IS MADE REGARDING ITS ACCURACY OR COMPLETENESS. USE OF THIS INFORMATION AND/OR PROGRAMS DESCRIBED IS AT YOUR OWN RISK.
ANY EASYLANGUAGE OR POWERLANGUAGE TRADING STRATEGIES, SIGNALS, STUDIES, INDICATORS, SHOWME STUDIES, PAINTBAR STUDIES, PROBABILITYMAP STUDIES, ACTIVITYBAR STUDIES, FUNCTIONS (AND PARTS THEREOF) AND ASSOCIATED TECHNIQUES REFERRED TO, INCLUDED IN OR ATTACHED TO THIS TUTORIAL OR PROGRAM DESCRIPTION ARE EXAMPLES ONLY, AND HAVE BEEN INCLUDED SOLELY FOR EDUCATIONAL PURPOSES. MARKPLEX CORPORATION. DOES NOT RECOMMEND THAT YOU USE ANY SUCH TRADING STRATEGIES, SIGNALS, STUDIES, INDICATORS, SHOWME STUDIES, PAINTBAR STUDIES, PROBABILITYMAP STUDIES, ACTIVITYBAR STUDIES, FUNCTIONS (OR ANY PARTS THEREOF) OR TECHNIQUES. THE USE OF ANY SUCH TRADING STRATEGIES, SIGNALS, STUDIES, INDICATORS, SHOWME STUDIES, PAINTBAR STUDIES, PROBABILITYMAP STUDIES, ACTIVITYBAR STUDIES, FUNCTIONS AND TECHNIQUES DOES NOT GUARANTEE THAT YOU WILL MAKE PROFITS, INCREASE PROFITS, OR MINIMIZE LOSSES.

