
Auto support and resistance show me study based on volume profile
Program 56 is available for immediate download for $134.95. The download is a TradeStation ELD file that includes the unprotected and commented program. This program will not work in MultiCharts because it uses the TradeStation collections and other functionality that is not available in the MultiCharts environment.
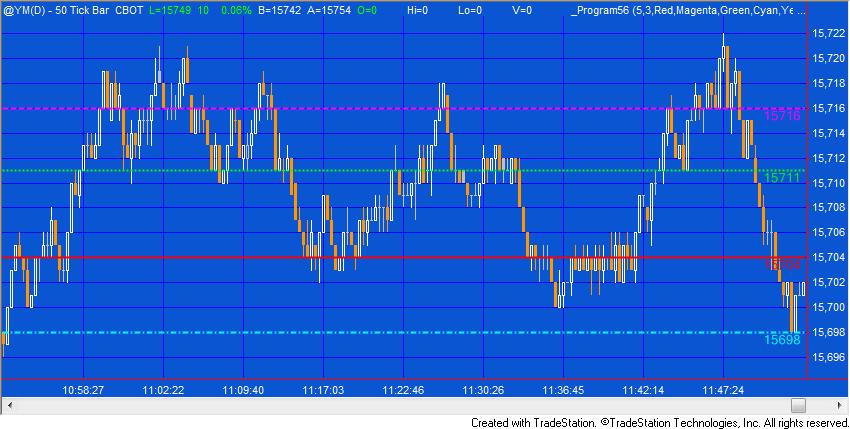
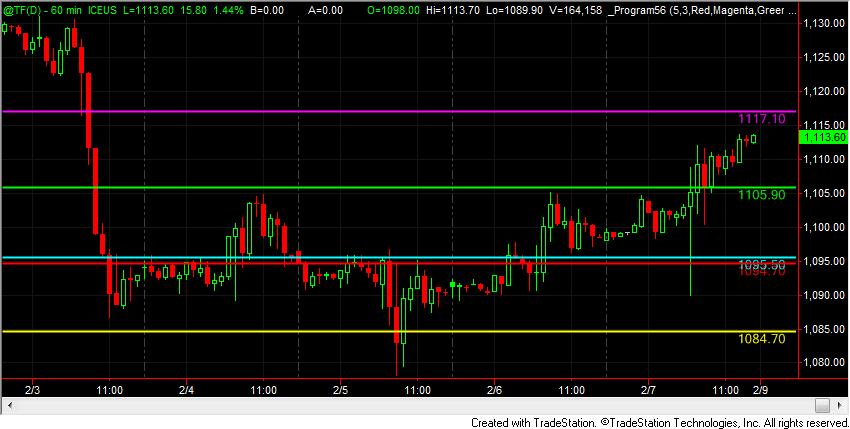
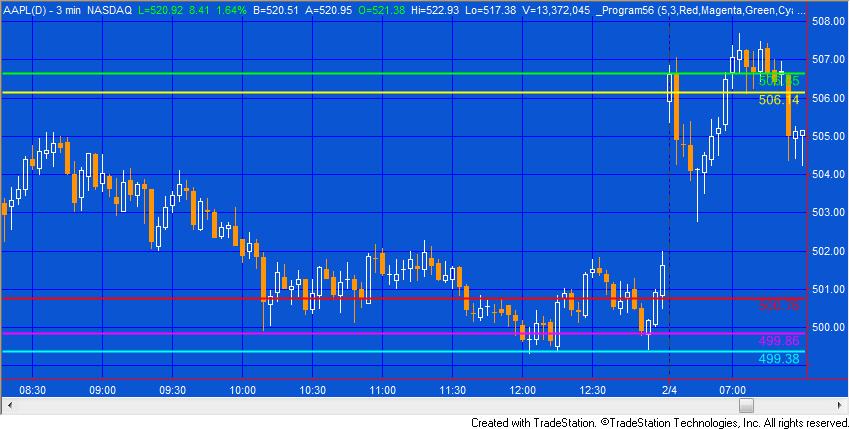
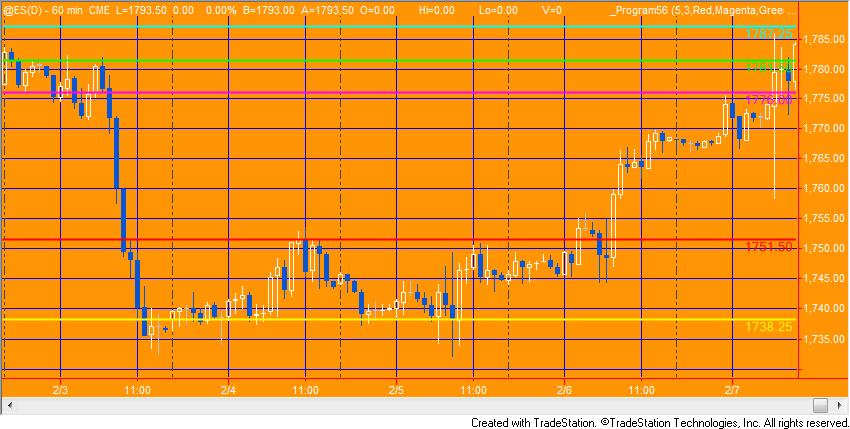
Program 56 creates horizontal support and resistance lines based on the chart’s volume profile.. The theory underlying program 56 is that if significant volume has occurred at a specific price level then that level may have some significance as an area of support and/or resistance.
Program 56 has some similarities with program 55. Both programs draw color coded and styled horizontal lines on the chart together with price labels, however program 55 calculates these lines based on previous price levels whereas program 56 uses a volume profile calculated for the entire chart.
How does program 56 calculate the volume profile?
At the close of each bar the program stores volume into a dictionary with a key of the closing price of the bar. If a key-value pair already exists in the dictionary for the price, the volume is added to the existing volume for that price. This collection of data begins on the second bar of the chart and continues as each new bar is formed.
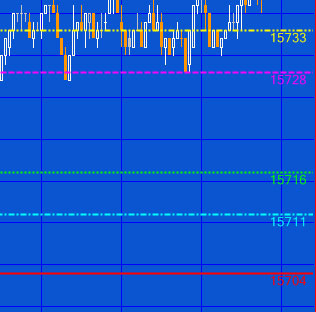
When the program is first applied to a chart or the price range visible on the screen changes, program 56 creates another dictionary that just contains data about the price levels currently visible. It then looks for volume pivots. These are stored in a dictionary. A vector of the keys is then sorted by their values and the resulting price levels are drawn on the chart. The volume pivot with the highest volume is drawn using Color1 and LineStyle1, the next highest is drawn using Color 2 and LineStyle 2 etc.
Volume or ticks?
For daily, weekly, monthly charts the keyword ‘volume’ is used for volume. For other charts the keyword ‘ticks’ is used for volume.
For minute data you can change the “For volume, use:” field in the Format Symbol dialog to Trade Vol or Tick Count, as you require.
Program 56 is available for immediate download for $134.95. The download is a TradeStation ELD file that includes the unprotected and commented program.
This program will not work in MultiCharts because it uses the TradeStation collections and other functionality that is not available in the MultiCharts environment.
Program 56 was designed for TradeStation 9.1 (update 22 and above). It works on tick, intraday, daily, weekly and monthly charts. This program will not work in MultiCharts because it uses the TradeStation collections and other functionality that is not available in the MultiCharts environment.
See the video below for a demonstration of the program.
Technical architecture
Program 56 makes extensive use of dictionaries and vectors. It also uses the TradeStation timer and the new drawing objects functionality.
Program 56 is probably a little easier to understand than program 55. It is also commented throughout.
Inputs for program 56
TopVolPivots
The total number of horizontal lines to be drawn, with the highest occurrence values. TopVolPivots must be a positive integer up to 20. This number determines the number of horizontal lines drawn on a chart. Clearly a large number might make the screen confusing whereas a smaller number might result in the user missing some important levels.
If you enter a number outside the 0 – 20 range, a runtime error will be generated.
Strength
Left and right strength of volume pivots
Line colors
The following inputs determine the color of the horizontal lines draw. Color1 would be for the level that has occurred the most frequently, color2 the level that occurred next most frequently etc. If there are the same number of occurrences at two or more levels, the most recent gets the ‘highest’ color. For example, if there were 40 occurrences at a price of $1.00 and 40 at $1.20 and 40 was the highest number of occurrences, then the pivot that occurred most recently at each level would determine which level was colored Col0r1 and which was colored Color2.
If TopVolPivots is greater than 10 the colors are ‘recycled’ at a slightly darker shade, so that Color11 would be a darker shade of Color1, Color12 would be a darker shade of Color2 etc
Color1( Red )
Color2( Magenta )
Color3( Green )
Color4( Cyan )
Color5( Yellow )
Color6( White )
Color7( White )
Color8( LightGray )
Color9( LightGray )
Color10( LightGray )
Line styles
Line styles are applied to the lines in the same way as the color styling, i.e. for the level with the highest number of occurrences would be styled using LineStyle1. The level with the next highest number of occurrences would be styled by using LineStyle2 etc.
The available styles are:
- Solid 0
- Dashed 1
- Dotted 2
- Dashed2 3
- Dashed3 4
LineStyle1( 0 )
LineStyle2( 0 )
LineStyle3( 0 )
LineStyle4( 0 )
LineStyle5( 0 )
LineStyle6( 0 )
LineStyle7( 0 )
LineStyle8( 0 )
LineStyle9( 0 )
LineStyle10( 0 )
FontName( “Ariel” )
Font name determines the font of the text that displays the price value of each line to the right of the chart.
FontSize( 10 )
Font size determines that size of the text that displays the price value of each line to the right of the chart.
LineThickness( 1 )
Defines thickness of lines. LineThickness can be an integer between 0 and 6. If a number outside this range is entered a runtime error will be generated.
UpdareFrequency( 5000 )
Determines how often the timer checks for changes in the upper and lower price values. In milliseconds. Since program 55 does a lot of programming it is advisable to keep this number as large as is feasible.
DrawLabels( True)
If set to true labels are added to the right of the horizontal lines.
Program 56 is available for immediate download for $134.95. The download is a TradeStation ELD file that includes the unprotected and commented program.
Video of program 56
Frequently Asked Questions
Q. I am seeing lines below or above the price action. How can this be?
A. Program 56 creates a volume profile based on bars from after the MaxBarsBack consequently lines above or below the prices currently visible indicate that there was volume at that level earlier in the chart’s history.
Q. I need to analyze an different or earlier series of bars?
A. Program 56 analyzes the bars on the current chart, so if you want to analyze a different period, edit the symbol to load the required number of bars or different start and end dates.
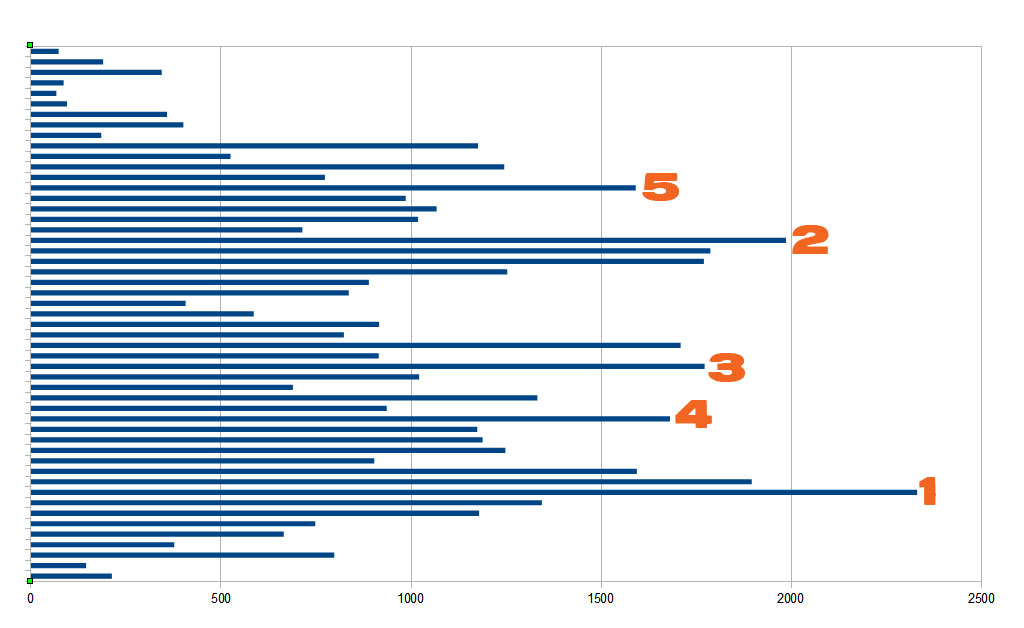
Q. Why can I not see the volume profile that was included in the video?
A. This is not part of the program. This graphic was created outside of TradeStation using OpenOffice.
Q. If I buy the program, how do I receive it?
A. After paying for the software you will be automatically forwarded back to Markplex where you will see a download link. You will also receive an email with a download link. If you have any problems email martyn.whittaker@markplex.com.
Program 56 is available for immediate download for $134.95. The download is a TradeStation ELD file that includes the unprotected and commented program.
This program will not work in MultiCharts because it uses the TradeStation collections and other functionality that is not available in the MultiCharts environment.
THESE INDICATORS, SHOW ME STUDIES, STRATEGIES AND OTHER PROGRAMS HAVE BEEN INCLUDED SOLELY FOR EDUCATIONAL PURPOSES.
TO THE BEST OF MARKPLEX CORPORATION’S KNOWLEDGE, ALL OF THE INFORMATION ON THIS PAGE IS CORRECT, AND IT IS PROVIDED IN THE HOPE THAT IT WILL BE USEFUL. HOWEVER, MARKPLEX CORPORATION ASSUMES NO LIABILITY FOR ANY DAMAGES, DIRECT OR OTHERWISE, RESULTING FROM THE USE OF THIS INFORMATION AND/OR PROGRAM(S) DESCRIBED, AND NO WARRANTY IS MADE REGARDING ITS ACCURACY OR COMPLETENESS. USE OF THIS INFORMATION AND/OR PROGRAMS DESCRIBED IS AT YOUR OWN RISK.
ANY EASYLANGUAGE OR POWERLANGUAGE TRADING STRATEGIES, SIGNALS, STUDIES, INDICATORS, SHOWME STUDIES, PAINTBAR STUDIES, PROBABILITYMAP STUDIES, ACTIVITYBAR STUDIES, FUNCTIONS (AND PARTS THEREOF) AND ASSOCIATED TECHNIQUES REFERRED TO, INCLUDED IN OR ATTACHED TO THIS TUTORIAL OR PROGRAM DESCRIPTION ARE EXAMPLES ONLY, AND HAVE BEEN INCLUDED SOLELY FOR EDUCATIONAL PURPOSES. MARKPLEX CORPORATION. DOES NOT RECOMMEND THAT YOU USE ANY SUCH TRADING STRATEGIES, SIGNALS, STUDIES, INDICATORS, SHOWME STUDIES, PAINTBAR STUDIES, PROBABILITYMAP STUDIES, ACTIVITYBAR STUDIES, FUNCTIONS (OR ANY PARTS THEREOF) OR TECHNIQUES. THE USE OF ANY SUCH TRADING STRATEGIES, SIGNALS, STUDIES, INDICATORS, SHOWME STUDIES, PAINTBAR STUDIES, PROBABILITYMAP STUDIES, ACTIVITYBAR STUDIES, FUNCTIONS AND TECHNIQUES DOES NOT GUARANTEE THAT YOU WILL MAKE PROFITS, INCREASE PROFITS, OR MINIMIZE LOSSES.