This tutorial, describing EasyLanguage techniques and tips, goes back to basics with step by step instructions on how to create a simple ShowMe study to highlight ‘inside bars’.
TO THE BEST OF MARKPLEX CORPORATION’S KNOWLEDGE, ALL OF THE INFORMATION ON THIS PAGE IS CORRECT, AND IT IS PROVIDED IN THE HOPE THAT IT WILL BE USEFUL. HOWEVER, MARKPLEX CORPORATION ASSUMES NO LIABILITY FOR ANY DAMAGES, DIRECT OR OTHERWISE, RESULTING FROM THE USE OF THIS INFORMATION AND/OR PROGRAM(S) DESCRIBED, AND NO WARRANTY IS MADE REGARDING ITS ACCURACY OR COMPLETENESS. USE OF THIS INFORMATION AND/OR PROGRAMS DESCRIBED IS AT YOUR OWN RISK.
ANY EASYLANGUAGE OR POWERLANGUAGE TRADING STRATEGIES, SIGNALS, STUDIES, INDICATORS, SHOWME STUDIES, PAINTBAR STUDIES, PROBABILITYMAP STUDIES, ACTIVITYBAR STUDIES, FUNCTIONS (AND PARTS THEREOF) AND ASSOCIATED TECHNIQUES REFERRED TO, INCLUDED IN OR ATTACHED TO THIS TUTORIAL OR PROGRAM DESCRIPTION ARE EXAMPLES ONLY, AND HAVE BEEN INCLUDED SOLELY FOR EDUCATIONAL PURPOSES. MARKPLEX CORPORATION. DOES NOT RECOMMEND THAT YOU USE ANY SUCH TRADING STRATEGIES, SIGNALS, STUDIES, INDICATORS, SHOWME STUDIES, PAINTBAR STUDIES, PROBABILITYMAP STUDIES, ACTIVITYBAR STUDIES, FUNCTIONS (OR ANY PARTS THEREOF) OR TECHNIQUES. THE USE OF ANY SUCH TRADING STRATEGIES, SIGNALS, STUDIES, INDICATORS, SHOWME STUDIES, PAINTBAR STUDIES, PROBABILITYMAP STUDIES, ACTIVITYBAR STUDIES, FUNCTIONS AND TECHNIQUES DOES NOT GUARANTEE THAT YOU WILL MAKE PROFITS, INCREASE PROFITS, OR MINIMIZE LOSSES.
Step 1
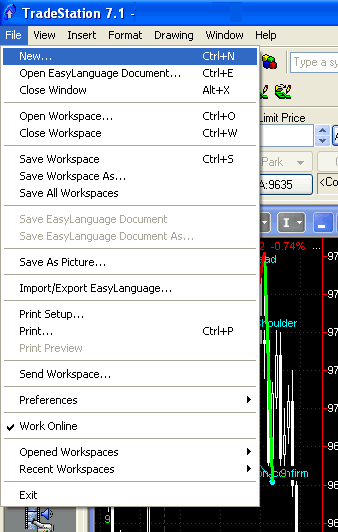
On your TradeStation menu click File with your left mouse button and then select New, also with your left mouse button.
Step 2
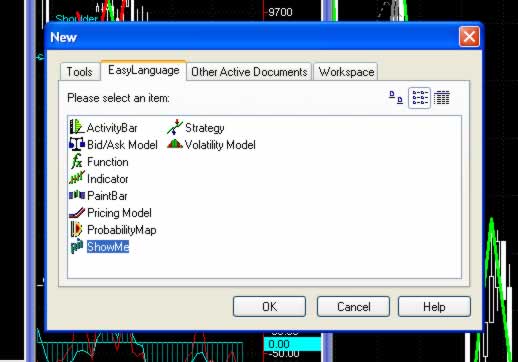
Click the EasyLanguage tab and then click ShowMe.
Step 3
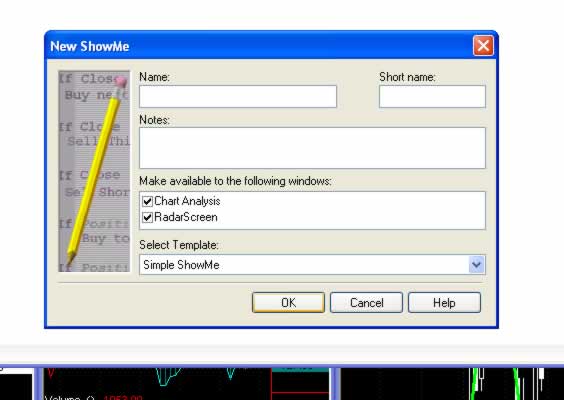
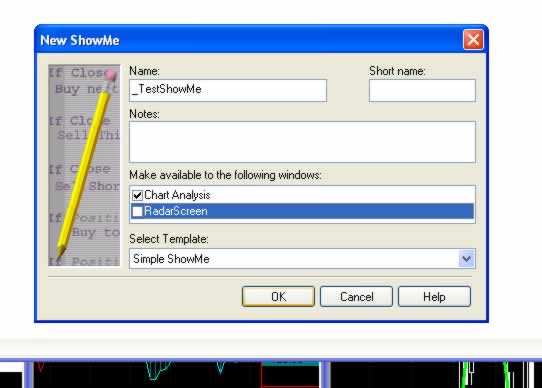
The new ShowMe form will appear. At a minimum you can enter the name of the ShowMe. A good tip is to put a ‘_’ or similar character in front of the name. This will ensure that you can find your ShowMe when you want to apply it to a chart – it also means that you will not confuse it with one of the TradeStation ShowMes. There is also space for Notes and an abbreviated name. The ‘Make available to the following windows’ enables you to make the ShowMe available to Charts and/or RadarScreens.
Step 4
Enter the name: ‘_TestShowMe’ and click the RadarScreen so that the ShowMe is only available to charts. Click the ‘OK’ button, or press your ENTER key.
Step 5
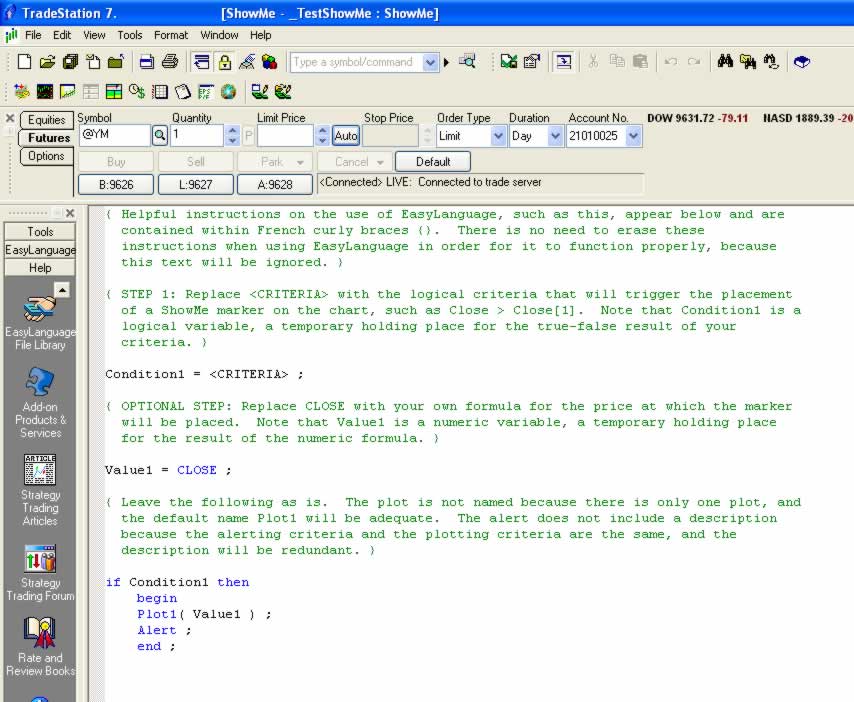
Your will now see the following screen. The text in green are comments. These have no affect on the working of the program itself, however, comments are very important because as your EasyLanguage programs become more complex, when you revisit your programs, comments will remind you of why you did certain things, hence they can save you a lot of time in the future. To add comments, press the ‘{‘ key, add comments and then press the ‘}’ key.
Step 6
Enter the program as shown on the following screen:
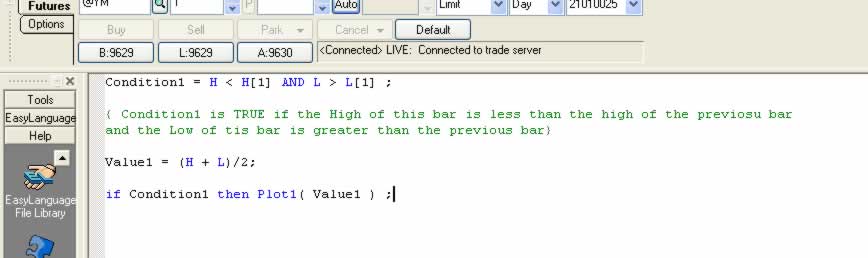
Condition1 is set to TRUE when the High of the latest bar is LESS THAN the High of the previous bar AND the Low of the present bar is GREATER THAN the Low of the previous bar. ‘H’ and ‘L’ are abbreviations for High and Low respectively. You could use ‘High’ and ‘Low’ instead if you prefer.
Value1 is equal to the average of the high and the low of the bar.
The last part of the program looks at Condition1. If it is TRUE, Plot1 plots a point at the Value1 position. see Step7.
Step 7
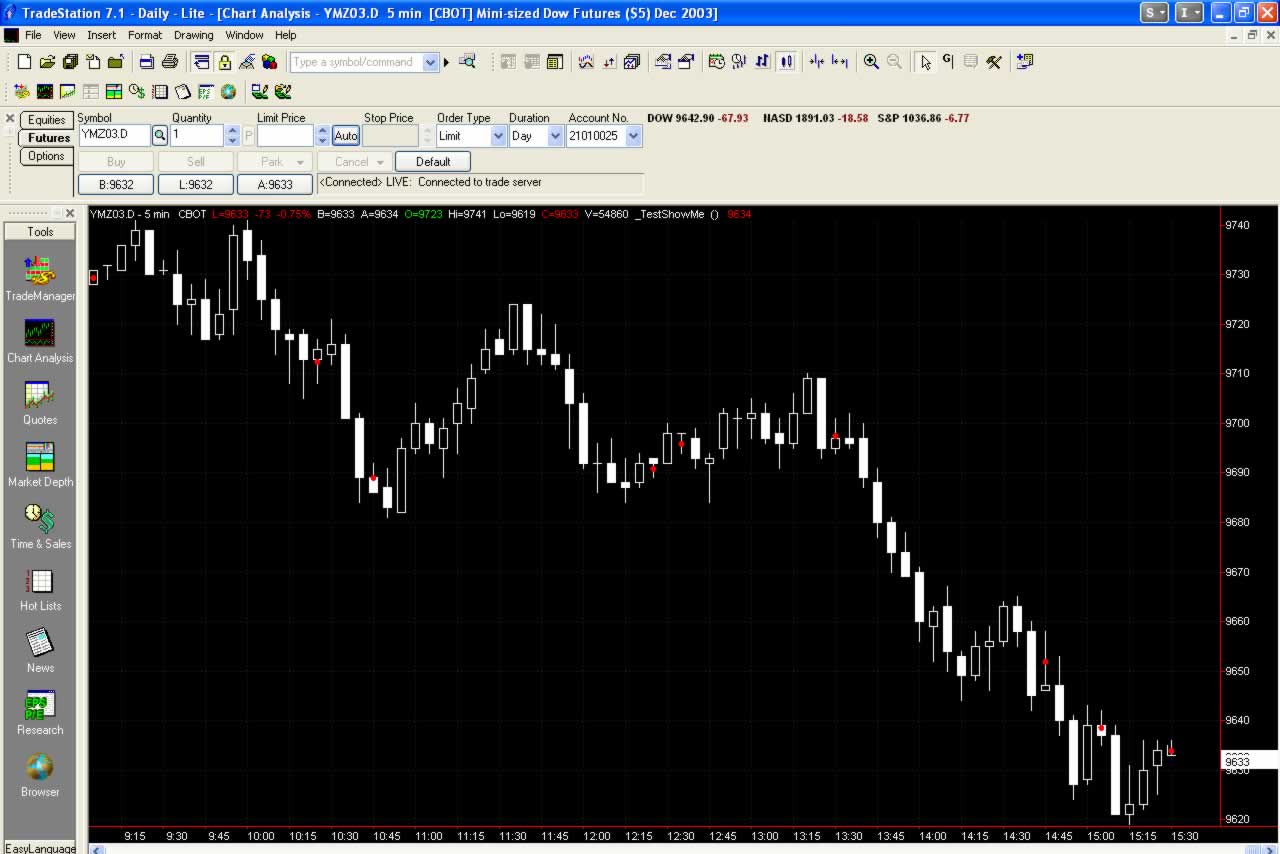
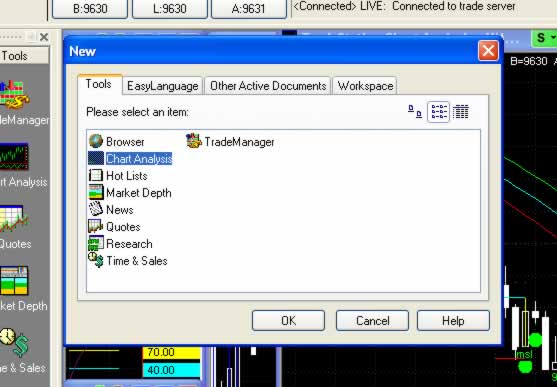
Open a chart.
Step 8
On the top bar of the TradeStation screen, click INSERT. Then click ShowMe. Scroll down to the ShowMe that we have created and click OK.
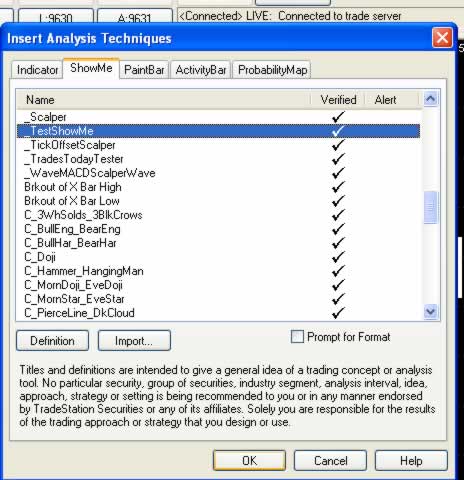
Step 9
You will notice that red dots appear between the high and low of ‘inside bars’. BEWARE: You may notice that there is seemingly an anomaly. If you let the chart develop during the day, some dots may appear on bars that are blatantly not inside bars. See Tutorial 2 | The NoPlot(num) statement for an explanation and the way to correct this.