
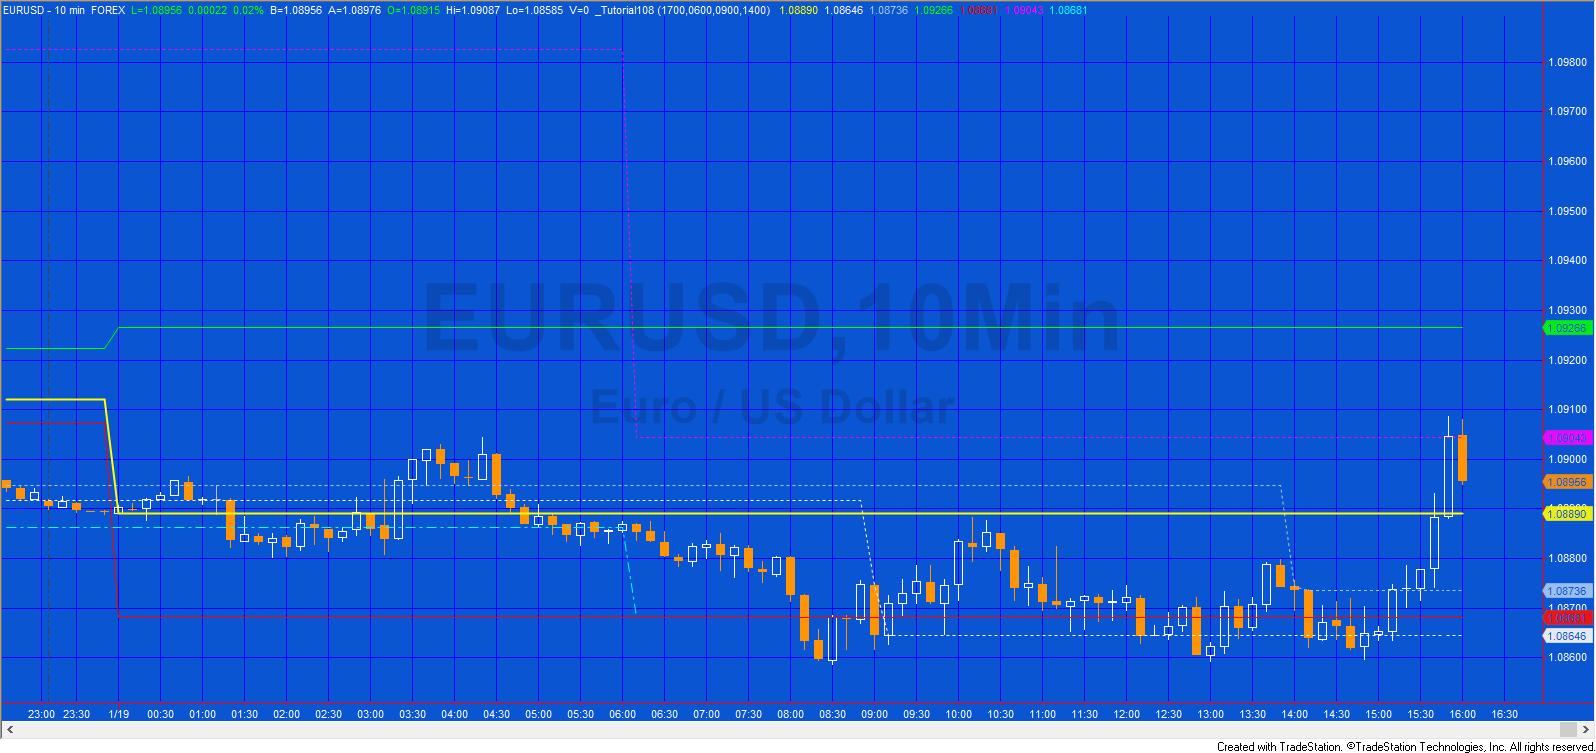
Plot lines at day open, high/low of day, high/low of user defined time period, and two user specified times
Tutorial 108 is a TradeStation EasyLanguage programming tutorial that demonstrates how to create an EasyLanguage indicator to plot lines at specific levels. The tutorial covers some of the same ground as Tutorial 45 | Finding the highest high for a period specified by start and end times but goes into more detail.
Tutorial 108 plots at the following levels:
- Plot 1: The opening price of the day
- Plot 2: The opening price of the bar that occurs at a user input time (Time1). Should there be no bar for this specific time, the open of the following bar is used
- Plot 3: The opening price of the bar that occurs at a user input time (Time2). Should there be no bar for this specific time, the open of the following bar is used
- Plot 4: The highest price of yesterday
- Plot 5: The lowest price of yesterday
- Plot 6: The highest price in a user specified time period
- Plot 7: The lowest price in a user specified time period
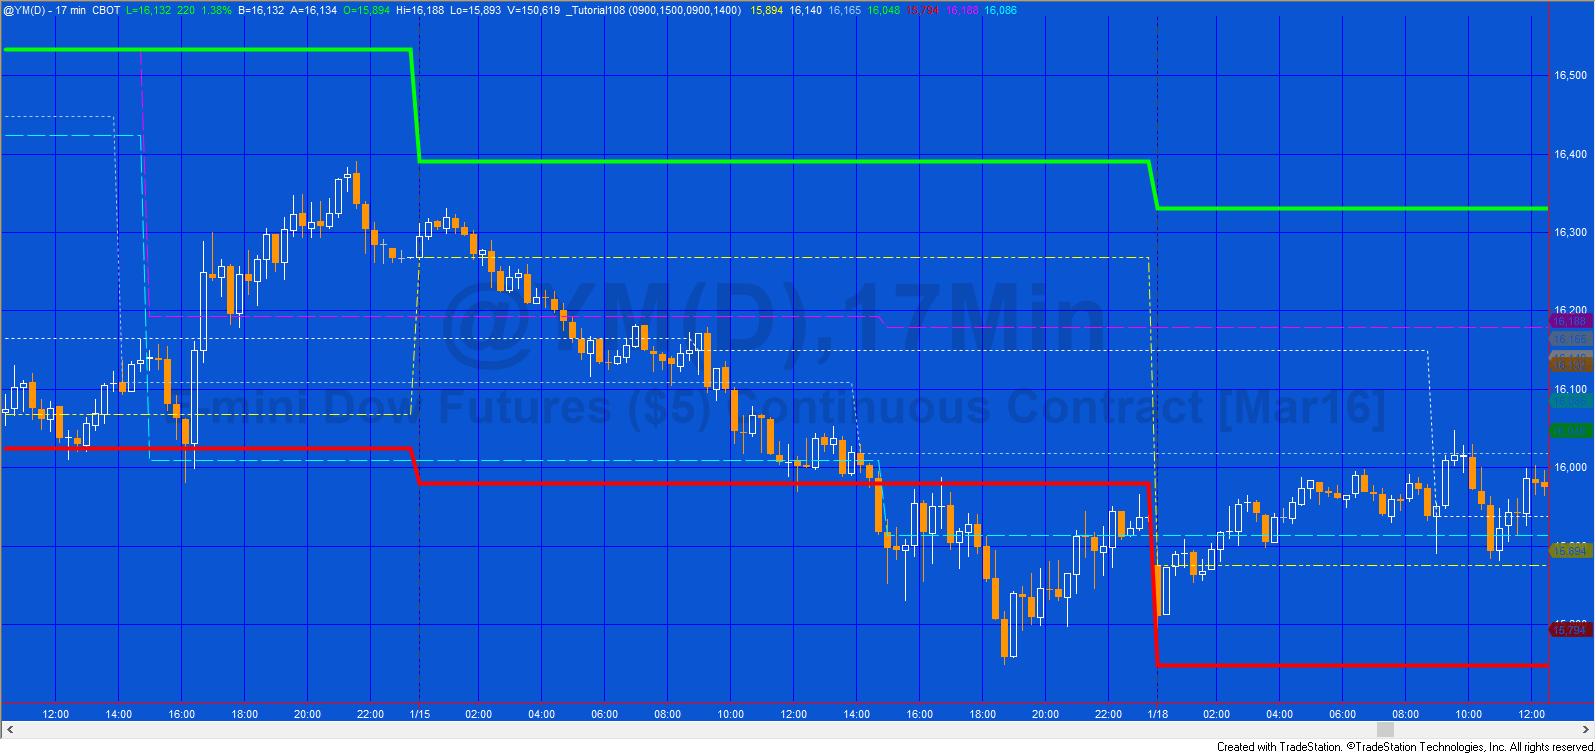
The color and shading of the plot line can be set in indicator properties.
The following video explains the development of the indicator:
Tutorial 108 video | part 1
Tutorial 108 video | part 2
This program is available as a free download for Gold Pass members, who will also receive a more advanced program that draws lines at both high and low pivots. I am also making the two programs available for download.
Tutorial 108 inputs
ONightStart( 1700 ), // The start time of a user defined session
ONightEnd( 0600 ), // The end time of a user defined session
Time1( 0900 ), // A specific user defined time that a line is drawn at its open
Time2( 1400 ); // A specific user defined time that a line is drawn at its open
Programming issues
Tutorial 108 is a fairly easy program to understand, however, there are a couple of areas that may need further explanation.
- The user of the program can specify the start time and end time of a user specified session. When the start time is less than the end time, checking whether or not the current time is within the session is easy. We might use:
InSession = T > Onightstart and T < Onightend;
However if the start time is a greater number than the end time (i.e. the end time occurs the next day) the above code will not work. Instead, we can test if the start time is numerically greater then the end time and then use the following:
InSession = ( T > Onightend and T < Onightstart ) = FALSEwhich basically looks for times when we are NOT in the user defined session and checks that this is FALSE.
- The user can specify two times and the program will plot lines at the level of the opening price for that time. This can be achieved by
If T = Time1 then Price1 = O;
Plot1( Price1 ):But what if there is no bar for a particular time? If that happened the variable Price1 would not be updated correctly and we might get a spurious result.
However we can perform a test to check if Price1 has been updated each day when the bar time is equal or greater then the user input time. This can be achieved by using:If T >= Time1 and Price1Found = False then
Begin
Price1Found = TRUE;
Price1 = O;
End;
Gold pass area
Download tutorial 108
Download the tutorial 108 eld: _Tutorial108.eld for $19.95
Gold pass members can download the program at no cost (see the Gold Pass area above. Make sure you are logged in to the site).
Please join our email list if you have not already done so and we will let you know when we release new tutorials or programs.
TO THE BEST OF MARKPLEX CORPORATION’S KNOWLEDGE, ALL OF THE INFORMATION ON THIS PAGE IS CORRECT, AND IT IS PROVIDED IN THE HOPE THAT IT WILL BE USEFUL. HOWEVER, MARKPLEX CORPORATION ASSUMES NO LIABILITY FOR ANY DAMAGES, DIRECT OR OTHERWISE, RESULTING FROM THE USE OF THIS INFORMATION AND/OR PROGRAM(S) DESCRIBED, AND NO WARRANTY IS MADE REGARDING ITS ACCURACY OR COMPLETENESS. USE OF THIS INFORMATION AND/OR PROGRAMS DESCRIBED IS AT YOUR OWN RISK.
ANY EASYLANGUAGE OR POWERLANGUAGE TRADING STRATEGIES, SIGNALS, STUDIES, INDICATORS, SHOWME STUDIES, PAINTBAR STUDIES, PROBABILITYMAP STUDIES, ACTIVITYBAR STUDIES, FUNCTIONS (AND PARTS THEREOF) AND ASSOCIATED TECHNIQUES REFERRED TO, INCLUDED IN OR ATTACHED TO THIS TUTORIAL OR PROGRAM DESCRIPTION ARE EXAMPLES ONLY, AND HAVE BEEN INCLUDED SOLELY FOR EDUCATIONAL PURPOSES. MARKPLEX CORPORATION. DOES NOT RECOMMEND THAT YOU USE ANY SUCH TRADING STRATEGIES, SIGNALS, STUDIES, INDICATORS, SHOWME STUDIES, PAINTBAR STUDIES, PROBABILITYMAP STUDIES, ACTIVITYBAR STUDIES, FUNCTIONS (OR ANY PARTS THEREOF) OR TECHNIQUES. THE USE OF ANY SUCH TRADING STRATEGIES, SIGNALS, STUDIES, INDICATORS, SHOWME STUDIES, PAINTBAR STUDIES, PROBABILITYMAP STUDIES, ACTIVITYBAR STUDIES, FUNCTIONS AND TECHNIQUES DOES NOT GUARANTEE THAT YOU WILL MAKE PROFITS, INCREASE PROFITS, OR MINIMIZE LOSSES.