
Strategy to analyze tick data to draw “oscillation frequency” as an histogram
Tutorial 110 demonstrates how to create a TradeStation EasyLanguage strategy designed to analyze tick data to calculate oscillation frequency and draw a histogram. This strategy does not generate any trades, it is written as a strategy in order to be able to use historic tick data.
The idea for the tutorial was that, perhaps, there would be a greater frequency of Oscillation when the market was reaching a time of uncertainty. Possible before a significant price adjustment.
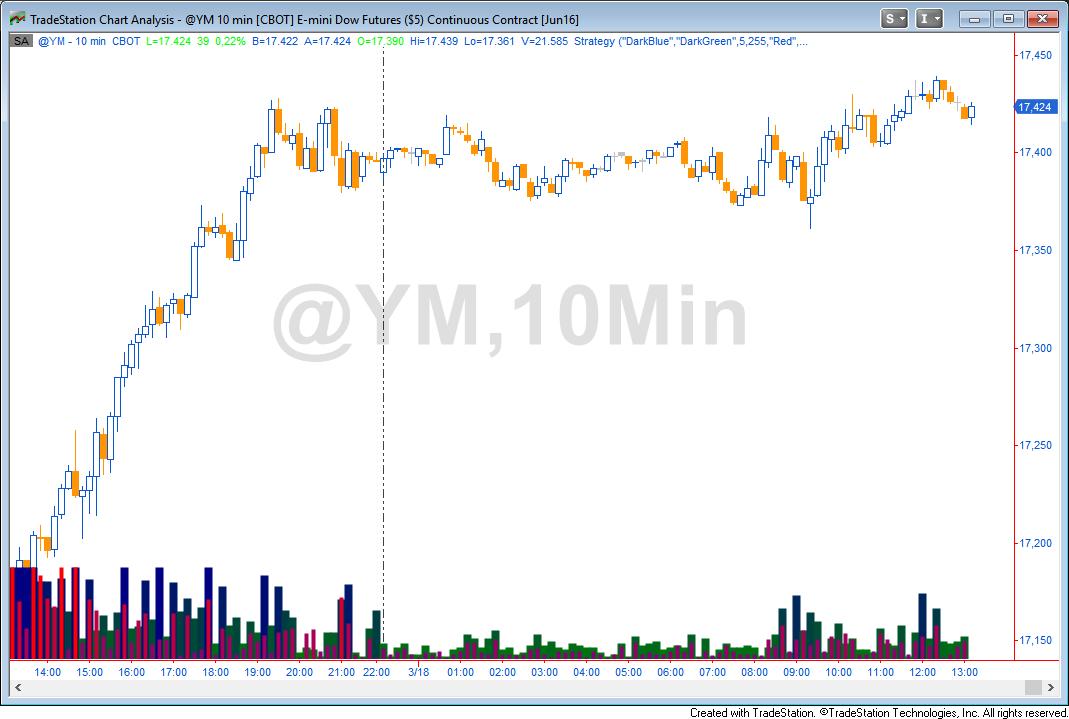
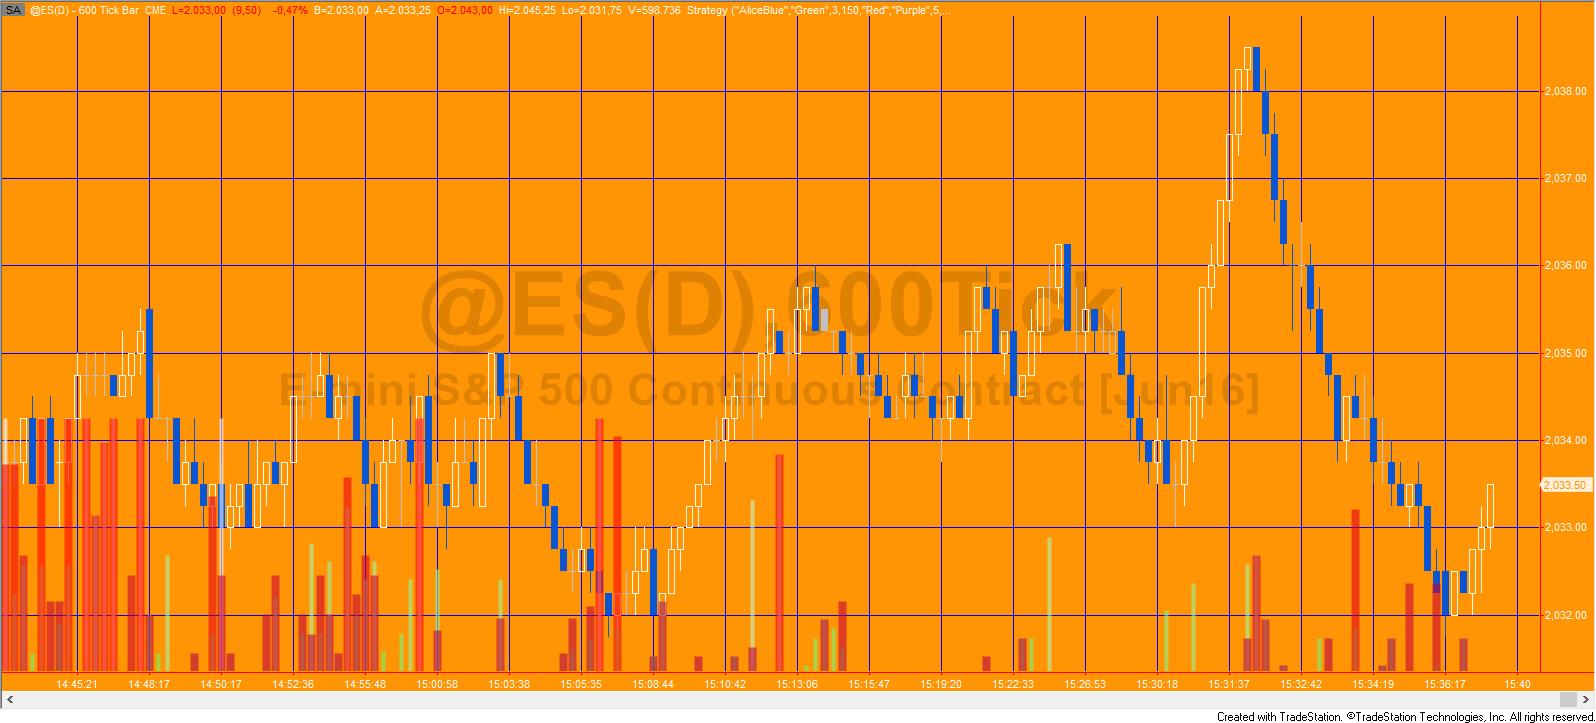
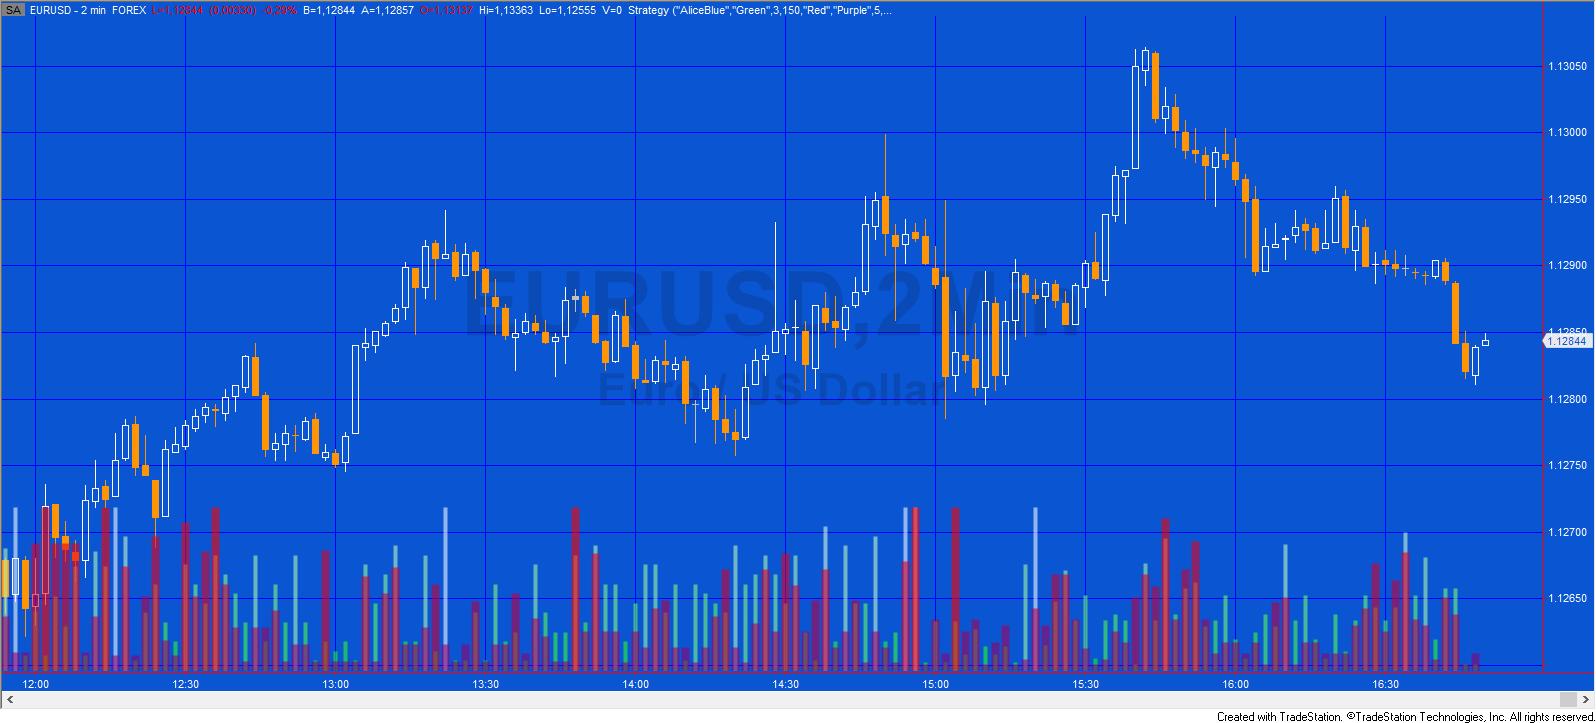
In the tutorial video I create a simpler version than the tutorial program that is available for download. For this tutorial I have defined oscillation frequency as the number of times price crosses the mid value (high plus low divided by two) . The frequency is plotted for the mid value cross by calculating the cross count and dividing it by the maximum cross count that has occurred since the strategy was applied to the chart for the bars analyzed. This frequency is multiplied by the visible height of the chart and this length is then drawn as a vertical line at the bottom of the chart for each bar.
The calculation is ONLY done for the bars visible on the chart when it is first applied and for new bars as they develop. Because the scaling is set when the program is applied to a chart or its status is turned to on, bars may start to be outside the visible frame if price falls below the original lower level. If this occurs the chart can be recalculated by pressing CTR-R.
The downloadable version of the program is a bit more sophisticated. It includes:
- The scaling factor as a user input
- An additional histogram of open/close average (open plus low divided by two) crosses overlaid over the mid value cross
- Inputs to vary the weight and transparency of the lines
- A gradient color method to calculate and vary the colors of the lines based on the length of the line
Technical lessons

In the tutorial video you will learn:
- The use of a vector to store tick data
- How to calculate the mid value and the number of times price crosses this value during the bar
- How to draw lines using TradeStation drawing objects
In the downloadable program you will find additional programming techniques, including creating a method to calculate the gradient color of a color object.
Details of the ColorGrad method for Gold Pass members
In the following protected area I have included the method that is included with the more advanced version of the tutorial program, included with the download and details of how to call the method.
The method is similar to the original TradeStation function: GradientColor which returns a specific color from a user defined gradient color range, such as Blue to White based the position of a number between the low and the high of a range. The new method’s inputs include the number, the low value of the range, the high value of the range, a string representing first color, another string for the second color and a value to determine the output color’s transparency. The method returns a color object.
The method is called as follows:
TL.Color = ColorGrad( Num, LowofRange, HighofRange, ColorStr1, ColorStr2, Trans );
If you are a Gold Pass member, make sure that you are logged in to see the code below.
Code for the ColorGrad method
Inputs
| Input | Default value | Description |
|---|---|---|
| HiColorMid | "AliceBlue" | "High" color for the number of crosses of the mid price |
| LoColorMid | "Green" | "Low" color for the number of crosses of the mid price |
| WeightMid | 3 | Weight of the lines drawn to represent the number of crosses of the mid price |
| ColTransMid | 150 | An integer between 0 and 255 to determine the transparency of the lines drawn to represent the number of crosses of the mid price |
| HiColorAvgOC | "Red" | "High" color for the number of crosses of the open/close average price |
| LoColorAvgOC | "Purple" | "Low" color for the number of crosses of the open/close average price |
| WeightAvgOC | 5 | Weight of the lines drawn to represent the number of crosses of the open/close average price |
| ColTransAvgOC | 150 | An integer between 0 and 255 to determine the transparency of the lines drawn to represent the number of crosses of the open/close average price |
| ScalingPerc | 25 | The maximum percentage of the visible chart that the lines will fill |
Tutorial 110 download
Tutorial 110 (the UNPROTECTED strategy) is available for IMMEDIATE download for $49.95- by clicking the ‘add to cart’ button. After download the programs can be opened, you will be able to see the program code and modify it if you wish.
After purchase you will be redirected to a download page, so don’t close the browser.
The download ELD includes two programs:
- a strategy called _Tutorial110
- a strategy called _Tutorial110tut1 (the program developed in the video)
Note that both program names begin with an underscore, so they should be towards the start of the list if you sort alphabetically.
After download, make sure that “Use Look-Inside bar backtesting” is set to on, with the resolution set to one tick. This is explained in the video below. N.B. The amount of tick data that TradeStation provide is limited.
If you are a Gold Pass member make sure you enter the special coupon code to get 20% discount off this price.
Tutorial 110 was developed for TradeStation 9.5 and will not work with MultiCharts.
Video demonstration of tutorial 110
Please note that any screen shots on this site are examples and are not meant to imply that any of these programs will generate profitable trades.
Color options for the advanced download
| AliceBlue | DarkSlateGray | LightSalmon | PaleVioletRed |
| AntiqueWhite | DarkTurquoise | LightSeaGreen | PapayaWhip |
| Aqua | DarkViolet | LightSkyBlue | PeachPuff |
| Aquamarine | DeepPink | LightSlateGray | Peru |
| Azure | DeepSkyBlue | LightSteelBlue | Pink |
| Beige | DimGray | LightYellow | Plum |
| Bisque | DodgerBlue | Lime | PowderBlue |
| Black | Firebrick | LimeGreen | Purple |
| BlanchedAlmond | FloralWhite | Linen | Red |
| Blue | ForestGreen | Magenta | RosyBrown |
| BlueViolet | Fuschia | Maroon | RoyalBlue |
| Brown | Gainsboro | MediumAquamarine | SaddleBrown |
| Burlywood | GhostWhite | MediumBlue | Salmon |
| CadetBlue | Gold | MediumOrchid | SandyBrown |
| Chartreuse | Goldenrod | MediumPurple | SeaGreen |
| Chocolate | Gray | MediumSeaGreen | Seashell |
| Coral | Green | MediumSlateBlue | Sienna |
| CornflowerBlue | GreenYellow | MediumSpringGreen | Silver |
| Cornsilk | Honeydew | MediumTurquoise | SkyBlue |
| Cyan | HotPink | MediumVioletRed | SlateBlue |
| DarkBlue | IndianRed | MidnightBlue | SlateGray |
| DarkBrown | Indigo | MintCream | Snow |
| DarkCyan | Ivory | MistyRose | SpringGreen |
| DarkGoldenrod | Khaki | Moccasin | SteelBlue |
| DarkGray | Lavender | NavajoWhite | Tan |
| DarkGreen | LavenderBlush | Navy | Teal |
| DarkKhaki | LawnGreen | OldLace | Thistle |
| Dark Magenta | LemonChiffon | Olive | Tomato |
| DarkOliveGreen | LightBlue | OliveDrab | Turquoise |
| DarkOrange | LightCoral | Orange | Violet |
| DarkOrchid | LightCyan | OrangeRed | Wheat |
| DarkRed | LightGoldenrodYellow | Orchid | White |
| DarkSalmon | LightGray | PaleGoldenrod | WhiteSmoke |
| DarkSeaGreen | LightGreen | PaleGreen | Yellow |
| DarkSlateBlue | LightPink | PaleTurquoise | YellowGreen |
THESE INDICATORS, SHOW ME STUDIES, STRATEGIES AND OTHER PROGRAMS HAVE BEEN INCLUDED SOLELY FOR EDUCATIONAL PURPOSES.
TO THE BEST OF MARKPLEX CORPORATION’S KNOWLEDGE, ALL OF THE INFORMATION ON THIS PAGE IS CORRECT, AND IT IS PROVIDED IN THE HOPE THAT IT WILL BE USEFUL. HOWEVER, MARKPLEX CORPORATION ASSUMES NO LIABILITY FOR ANY DAMAGES, DIRECT OR OTHERWISE, RESULTING FROM THE USE OF THIS INFORMATION AND/OR PROGRAM(S) DESCRIBED, AND NO WARRANTY IS MADE REGARDING ITS ACCURACY OR COMPLETENESS. USE OF THIS INFORMATION AND/OR PROGRAMS DESCRIBED IS AT YOUR OWN RISK.
ANY EASYLANGUAGE OR POWERLANGUAGE TRADING STRATEGIES, SIGNALS, STUDIES, INDICATORS, SHOWME STUDIES, PAINTBAR STUDIES, PROBABILITYMAP STUDIES, ACTIVITYBAR STUDIES, FUNCTIONS (AND PARTS THEREOF) AND ASSOCIATED TECHNIQUES REFERRED TO, INCLUDED IN OR ATTACHED TO THIS TUTORIAL OR PROGRAM DESCRIPTION ARE EXAMPLES ONLY, AND HAVE BEEN INCLUDED SOLELY FOR EDUCATIONAL PURPOSES. MARKPLEX CORPORATION. DOES NOT RECOMMEND THAT YOU USE ANY SUCH TRADING STRATEGIES, SIGNALS, STUDIES, INDICATORS, SHOWME STUDIES, PAINTBAR STUDIES, PROBABILITYMAP STUDIES, ACTIVITYBAR STUDIES, FUNCTIONS (OR ANY PARTS THEREOF) OR TECHNIQUES. THE USE OF ANY SUCH TRADING STRATEGIES, SIGNALS, STUDIES, INDICATORS, SHOWME STUDIES, PAINTBAR STUDIES, PROBABILITYMAP STUDIES, ACTIVITYBAR STUDIES, FUNCTIONS AND TECHNIQUES DOES NOT GUARANTEE THAT YOU WILL MAKE PROFITS, INCREASE PROFITS, OR MINIMIZE LOSSES.