
TradeStation methods with multiple outputs
EasyLanguage methods are pieces of ‘in-line’ code (i.e. they are not in a separate program, like a function) that are called from within the program. They can call themselves recursively (see tutorial 95 where a method is used recursively to do a fast sort of a vector). It can be a good way of organizing code and potentially using the same functionality several times in a program. If you subsequently found a bug in the method then it would only need to be fixed once.
In this tutorial I demonstrate how to create:
- a ‘void’ method that does not return a value
- a similar method that returns a double value
- a third method that returns 2 double values
In all three cases, the method calculates a linear regression and draws a linear regression line.
I have recorded three videos, one that explains each version of the method.
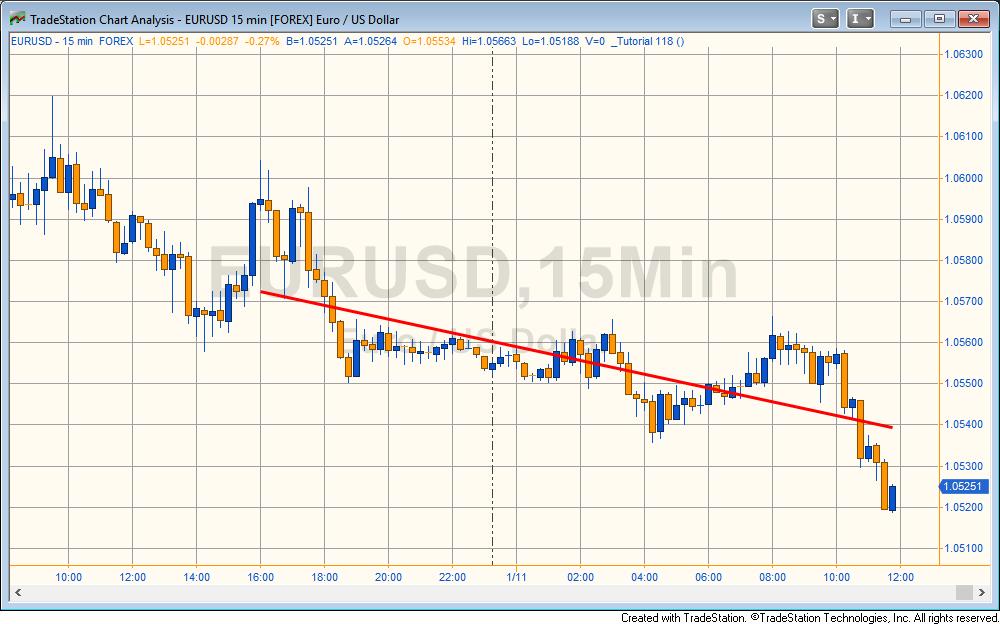
Tutorial 118 calculates the linear regression using the same calculation as tutorial 45, which includes a full explanation.
The method has the following inputs: int StartBar, int NumBars, string LineColor, int TLWeight.
StartBar tells the method at which bar to start the calculation. If it is set to zero it starts the calculation on the most recent bar. If it is set to 3 it starts the calculation on the 4th most recent bar (the count starts on zero).
The NumBars parameter tells the method how many bars to use in the linear regression calculation.
LineColor is a string which determines the color of the linear regression line to be drawn on the chart.
TLWeight determines the weight of the the linear regression line to be drawn on the chart. The value can be set between 0 and 6.
Gold Pass members may copy the code from the Gold Pass area below for free. Make sure that you are logged into your Gold Pass account.
After purchase you will be redirected to a download page, so don’t close the browser.
Programming lessons
Tutorial 118 is commented within the program and demonstrate various useful programming techniques and constructs, including:
- Creating BNPoints
- Drawing a trendline
- Calculating the linear regression
- Using the new TradeStation palette of colors
- Working with methods that return multiple values
Video demonstration of tutorial 118 – part 1
Video demonstration of tutorial 118 – part 2
Video demonstration of tutorial 118 – part 3
Program 118 bonus content for Gold Pass members
Program download
After purchase you will be redirected to a download page, so don’t close the browser.
Note that the program names begins with an underscore.
Use of BNPoints
A BNPoint refers to the absolute bar index (zero-based) of the collection of bars in a chart. This is not the same as the BarNumber function or CurrentBar reserved word which count the number of bars available for analysis MaxBarsBack. So to create a BNPoint for the current bar (BarNumber) would be:
NewBar = BarNumber + MaxBarsBack – 1;
Another issue that can cause what appear to be spurious results are the ‘Show empty daily trading periods for traditional chart types’ and ‘Show empty intraday session periods for traditional chart types’ settings.
A BNPoint refers to the absolute bar index (zero-based) of the collection of bars in a chart. This is not the same as the BarNumber function or CurrentBar reserved word which count the number of bars available for analysis after MaxBarsBack. So to create a BNPoint for the current bar (BarNumber) would be:
NewBar = BarNumber + MaxBarsBack – 1;
Another issue that can cause what appear to be spurious results are the ‘Show empty daily trading periods for traditional chart types’ and ‘Show empty intraday session periods for traditional chart types’ settings.
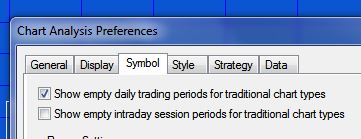
If these are selected, the chart includes blank bars which ‘confuse’ the bar number for BNPoints. For example, in the following daily chart of IBM, the ‘Show empty daily trading periods for traditional chart types’ is selected.
Available colors
| AliceBlue | DarkSlateGray | LightSalmon | PaleVioletRed |
| AntiqueWhite | DarkTurquoise | LightSeaGreen | PapayaWhip |
| Aqua | DarkViolet | LightSkyBlue | PeachPuff |
| Aquamarine | DeepPink | LightSlateGray | Peru |
| Azure | DeepSkyBlue | LightSteelBlue | Pink |
| Beige | DimGray | LightYellow | Plum |
| Bisque | DodgerBlue | Lime | PowderBlue |
| Black | Firebrick | LimeGreen | Purple |
| BlanchedAlmond | FloralWhite | Linen | Red |
| Blue | ForestGreen | Magenta | RosyBrown |
| BlueViolet | Fuschia | Maroon | RoyalBlue |
| Brown | Gainsboro | MediumAquamarine | SaddleBrown |
| Burlywood | GhostWhite | MediumBlue | Salmon |
| CadetBlue | Gold | MediumOrchid | SandyBrown |
| Chartreuse | Goldenrod | MediumPurple | SeaGreen |
| Chocolate | Gray | MediumSeaGreen | Seashell |
| Coral | Green | MediumSlateBlue | Sienna |
| CornflowerBlue | GreenYellow | MediumSpringGreen | Silver |
| Cornsilk | Honeydew | MediumTurquoise | SkyBlue |
| Cyan | HotPink | MediumVioletRed | SlateBlue |
| DarkBlue | IndianRed | MidnightBlue | SlateGray |
| DarkBrown | Indigo | MintCream | Snow |
| DarkCyan | Ivory | MistyRose | SpringGreen |
| DarkGoldenrod | Khaki | Moccasin | SteelBlue |
| DarkGray | Lavender | NavajoWhite | Tan |
| DarkGreen | LavenderBlush | Navy | Teal |
| DarkKhaki | LawnGreen | OldLace | Thistle |
| Dark Magenta | LemonChiffon | Olive | Tomato |
| DarkOliveGreen | LightBlue | OliveDrab | Turquoise |
| DarkOrange | LightCoral | Orange | Violet |
| DarkOrchid | LightCyan | OrangeRed | Wheat |
| DarkRed | LightGoldenrodYellow | Orchid | White |
| DarkSalmon | LightGray | PaleGoldenrod | WhiteSmoke |
| DarkSeaGreen | LightGreen | PaleGreen | Yellow |
| DarkSlateBlue | LightPink | PaleTurquoise | YellowGreen |
THESE INDICATORS, SHOW ME STUDIES, STRATEGIES AND OTHER PROGRAMS HAVE BEEN INCLUDED SOLELY FOR EDUCATIONAL PURPOSES.
TO THE BEST OF MARKPLEX CORPORATION’S KNOWLEDGE, ALL OF THE INFORMATION ON THIS PAGE IS CORRECT, AND IT IS PROVIDED IN THE HOPE THAT IT WILL BE USEFUL. HOWEVER, MARKPLEX CORPORATION ASSUMES NO LIABILITY FOR ANY DAMAGES, DIRECT OR OTHERWISE, RESULTING FROM THE USE OF THIS INFORMATION AND/OR PROGRAM(S) DESCRIBED, AND NO WARRANTY IS MADE REGARDING ITS ACCURACY OR COMPLETENESS. USE OF THIS INFORMATION AND/OR PROGRAMS DESCRIBED IS AT YOUR OWN RISK.
ANY EASYLANGUAGE OR POWERLANGUAGE TRADING STRATEGIES, SIGNALS, STUDIES, INDICATORS, SHOWME STUDIES, PAINTBAR STUDIES, PROBABILITYMAP STUDIES, ACTIVITYBAR STUDIES, FUNCTIONS (AND PARTS THEREOF) AND ASSOCIATED TECHNIQUES REFERRED TO, INCLUDED IN OR ATTACHED TO THIS TUTORIAL OR PROGRAM DESCRIPTION ARE EXAMPLES ONLY, AND HAVE BEEN INCLUDED SOLELY FOR EDUCATIONAL PURPOSES. MARKPLEX CORPORATION. DOES NOT RECOMMEND THAT YOU USE ANY SUCH TRADING STRATEGIES, SIGNALS, STUDIES, INDICATORS, SHOWME STUDIES, PAINTBAR STUDIES, PROBABILITYMAP STUDIES, ACTIVITYBAR STUDIES, FUNCTIONS (OR ANY PARTS THEREOF) OR TECHNIQUES. THE USE OF ANY SUCH TRADING STRATEGIES, SIGNALS, STUDIES, INDICATORS, SHOWME STUDIES, PAINTBAR STUDIES, PROBABILITYMAP STUDIES, ACTIVITYBAR STUDIES, FUNCTIONS AND TECHNIQUES DOES NOT GUARANTEE THAT YOU WILL MAKE PROFITS, INCREASE PROFITS, OR MINIMIZE LOSSES.