
In this tutorial (created with TradeStation version 8.1) we will create a simple indicator that draws lines on a chart when the price action moves from a high pivot to a low pivot and back to a high pivot AND the ratio of the first high to low is in a Fibonacci ratio (or close to a Fibonacci ratio) with the low pivot to high pivot. The indicator should run on any time scale.
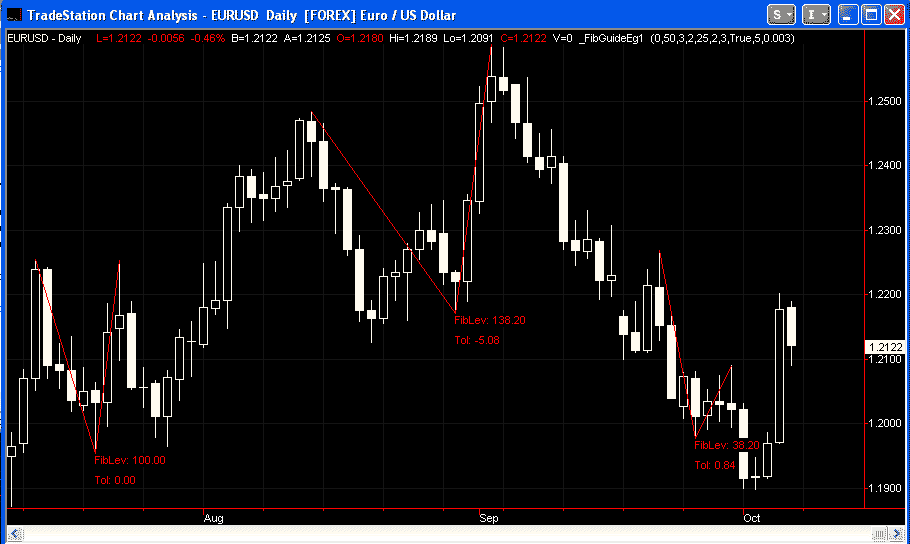
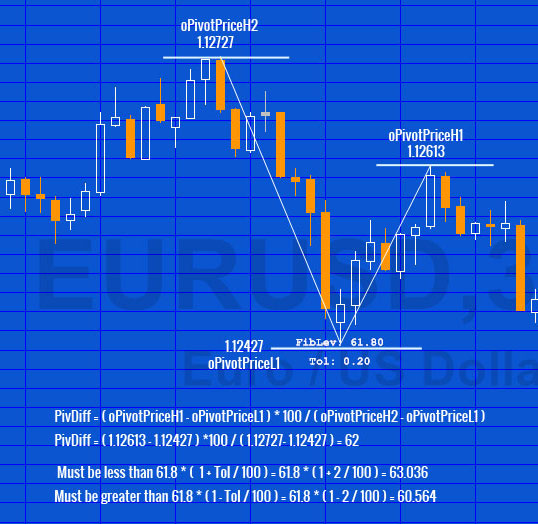
The following chart is the result of applying the program to a daily EURUSD chart. In each case, the low of the second pivot is subtracted from the high of the first pivot. The low of the second pivot is subtracted form the high of the third pivot. The result of this calculation is divided by the result of the first calculation to create the ration. Notice that under each ‘pattern’ there is printed that shows the Fibonacci ratio that the pattern is close to and the number below shows the difference been this Fibonacci ration and the actual ratio, i.e. the closer this number is to zero, the closer the ratio is to a Fibonacci ratio.
The indicator will demonstrate the recognition of pivot (turning) points, the drawing of lines and text objects on a chart and the creation of a 1 dimensional array to store Fibonacci rations and a 2 dimensional array to store the drawing object references.
You may follow the tutorial and copy and type the program to try it out. If you would prefer to cut down your typing, you may, for nominal fee of $29.95, download an enhanced program here:
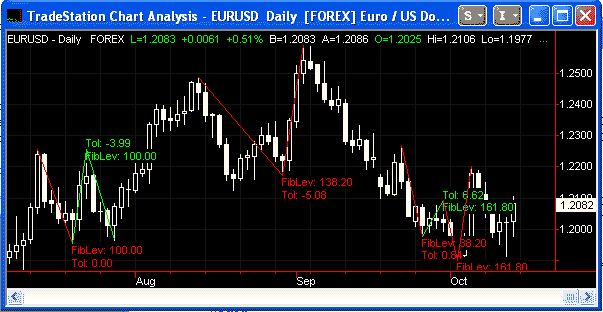
After payment, your software is available for immediate download. This download version includes the high – low – high example included in this tutorial – it also includes the low – high – low equivalent. See the following chart for an example:
Step 1
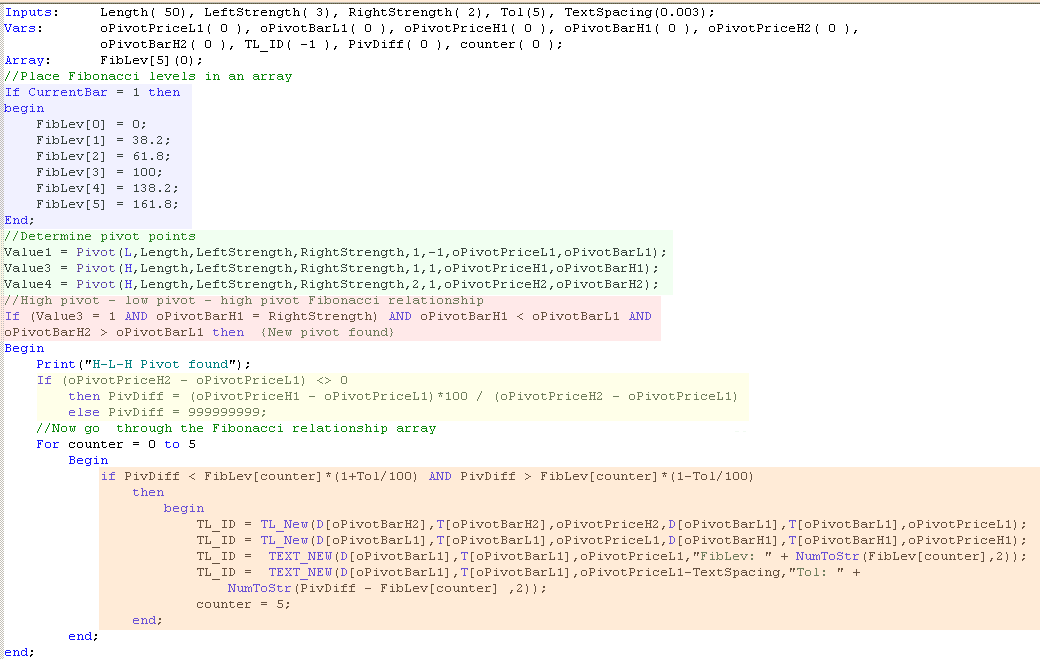
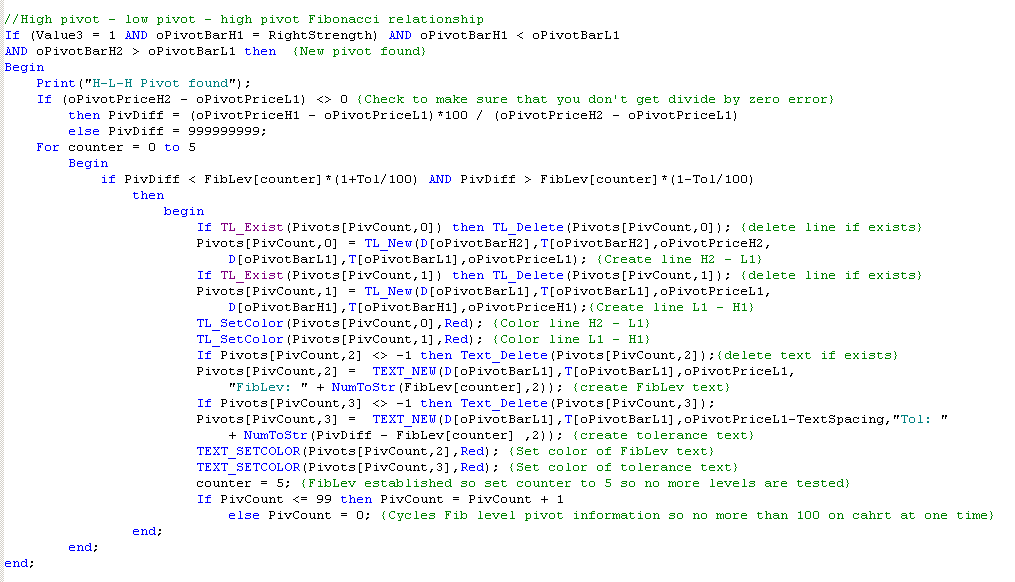
To start, create a new indicator (if you are not sure how to do this, review some of the earlier tutorials) and enter the following (ignore the color blocks – I added these for clarification):
Let’s look at each part of the program in turn:
The are colored blue shows the FibLiv[5] 1 dimensional array containing 6 elements (0,1,2,3,4,5). When currentbar =1 the first part of the program ‘populates’ this array with the Fibonacci levels that we are going to use in this program.
The area colored green looks for high and low pivots. If you enter this line and then, with your mouse, right click the word ‘Pivot’ and then click definition, this will give you an understanding of the syntax.
The area colored pink determines that there has been a high pivot ((Value3 = 1) that the high pivot occurred RightStrength bars ago (oPivotBarH1 = RightStrength) and that we have the basic pattern of this high bar took place less bars ago than the previous pivot low (oPivotBarH1 < oPivotBarL1) and that the high pivot before the one we have just discovered, took place a greater number of bars than the low pivot (oPivotBarH2 > oPivotBarL1).
The area highlighted in yellow calculates the the ratios of the previous pivot high and the pivot low and the current pivot high less the pivot low.
The area highlighted in orange determines whether the ratios of the previous pivot high and the pivot low and the current pivot high less the pivot low (calculated in the area colored yellow above) are equal to a Fibonacci ratio (or close). It does this by going through the FibLev array and comparing the values to each element of the array. If it finds one that is with ‘tol’ percentage of the Fibonnaci level it does 2 things.
1. It sets the counter variable to 5 so no more levels are looked at.
2. It draws lines using the TL_new command and adds informational text using the Text_New command.
You can review the syntax for these commands by clicking them with the right mouse button and clicking on ‘Definition of…”
Notice that variables (numbers) can be printed using Text_New, however they must be converted to strings using the NumToStr command before Text_New can print the numbers on the chart..
Step 2
In the above program we created various drawing and text objects. In each case the ID of the object was temporarily stored in the TL_ID variable. This works fine unless you reach the limit of text and drawing objects that can be placed on a chart. Because we have kept no permanent record of drawing and text object IDs, it is difficult to go back and delete drawing objects to allow new ones to be printed.
One solution to this issue is to create a second array and to store the drawing object references in the array. By going back over the array we can delete the drawing objects. BEWARE: you must check that a drawing object actually exists before trying to delete it otherwise an error will be generated and no further drawing object will be printed to the chart.
Enter the following modifications to the program above, as follows:
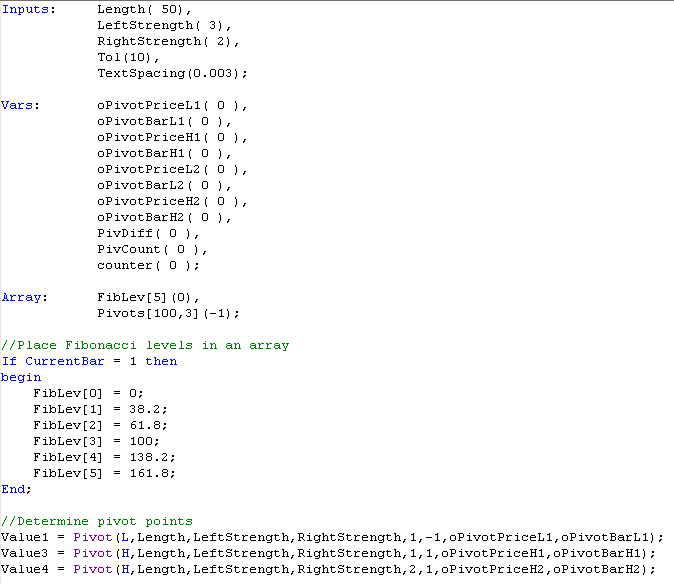
This new version uses an array: Pivots[Pivcount,x] to store the reference of the drawing objects. For each pattern we create 2 lines and 2 lines of text – hence, for each pattern we need to store 4 prices of information. These are stored in the following array elements: Pivots[Pivcount,0], Pivots[Pivcount,1], Pivots[Pivcount,2] and Pivots[Pivcount,3] where Pivcount is the number of the pattern. The program allows a 100 patterns to be created – then when it reached this number it goes back to the beginning of the array and starts deleting the patterns and replacing with a new pattern.
Step 3
Validate the program and apply to a chart.
If you would prefer to cut down your typing, you may, for nominal fee of $29.95, download an enhanced program here:
After payment, your software is available for immediate download. This version adds the extra complexity of looking for L-H-L as well as H-L-H formations. See below for an example of what it looks like when applied to a chart:
If you see any errors in this tutorial – or I have not made something clear, please let me know. You can e-mail me at: tutorials@markplex.com. Also, let me know if you have any ideas for new tutorials.
Video explaining tutorial 15
Example Fibonacci calculation included in the program
Summary
This tutorial demonstrates TradeStation’s EasyLanguage capability of dynamically drawing lines and text on a chart and recognizing pivot points.
TO THE BEST OF MARKPLEX CORPORATION’S KNOWLEDGE, ALL OF THE INFORMATION ON THIS PAGE IS CORRECT, AND IT IS PROVIDED IN THE HOPE THAT IT WILL BE USEFUL. HOWEVER, MARKPLEX CORPORATION ASSUMES NO LIABILITY FOR ANY DAMAGES, DIRECT OR OTHERWISE, RESULTING FROM THE USE OF THIS INFORMATION AND/OR PROGRAM(S) DESCRIBED, AND NO WARRANTY IS MADE REGARDING ITS ACCURACY OR COMPLETENESS. USE OF THIS INFORMATION AND/OR PROGRAMS DESCRIBED IS AT YOUR OWN RISK.
ANY EASYLANGUAGE OR POWERLANGUAGE TRADING STRATEGIES, SIGNALS, STUDIES, INDICATORS, SHOWME STUDIES, PAINTBAR STUDIES, PROBABILITYMAP STUDIES, ACTIVITYBAR STUDIES, FUNCTIONS (AND PARTS THEREOF) AND ASSOCIATED TECHNIQUES REFERRED TO, INCLUDED IN OR ATTACHED TO THIS TUTORIAL OR PROGRAM DESCRIPTION ARE EXAMPLES ONLY, AND HAVE BEEN INCLUDED SOLELY FOR EDUCATIONAL PURPOSES. MARKPLEX CORPORATION. DOES NOT RECOMMEND THAT YOU USE ANY SUCH TRADING STRATEGIES, SIGNALS, STUDIES, INDICATORS, SHOWME STUDIES, PAINTBAR STUDIES, PROBABILITYMAP STUDIES, ACTIVITYBAR STUDIES, FUNCTIONS (OR ANY PARTS THEREOF) OR TECHNIQUES. THE USE OF ANY SUCH TRADING STRATEGIES, SIGNALS, STUDIES, INDICATORS, SHOWME STUDIES, PAINTBAR STUDIES, PROBABILITYMAP STUDIES, ACTIVITYBAR STUDIES, FUNCTIONS AND TECHNIQUES DOES NOT GUARANTEE THAT YOU WILL MAKE PROFITS, INCREASE PROFITS, OR MINIMIZE LOSSES.
If you have any questions about the above material or you would like to point out a correction or typo, please e-mail: tutorials@markplex.com. Also e-mail if you have any ideas for future tutorials.