
This tutorial describes EasyLanguage techniques and tips looks at the creation of a 3-line moving average plot with a ‘twist’. Instead of simply plotting the information on a chart, we will also ‘print’ the information to the TradeStation print log. We will then ‘print’ to a text file on your hard disk, which the file can be opened and formatted in Microsoft® Excel® or similar spreadsheet package.
TO THE BEST OF MARKPLEX CORPORATION’S KNOWLEDGE, ALL OF THE INFORMATION ON THIS PAGE IS CORRECT, AND IT IS PROVIDED IN THE HOPE THAT IT WILL BE USEFUL. HOWEVER, MARKPLEX CORPORATION ASSUMES NO LIABILITY FOR ANY DAMAGES, DIRECT OR OTHERWISE, RESULTING FROM THE USE OF THIS INFORMATION AND/OR PROGRAM(S) DESCRIBED, AND NO WARRANTY IS MADE REGARDING ITS ACCURACY OR COMPLETENESS. USE OF THIS INFORMATION AND/OR PROGRAMS DESCRIBED IS AT YOUR OWN RISK.
ANY EASYLANGUAGE OR POWERLANGUAGE TRADING STRATEGIES, SIGNALS, STUDIES, INDICATORS, SHOWME STUDIES, PAINTBAR STUDIES, PROBABILITYMAP STUDIES, ACTIVITYBAR STUDIES, FUNCTIONS (AND PARTS THEREOF) AND ASSOCIATED TECHNIQUES REFERRED TO, INCLUDED IN OR ATTACHED TO THIS TUTORIAL OR PROGRAM DESCRIPTION ARE EXAMPLES ONLY, AND HAVE BEEN INCLUDED SOLELY FOR EDUCATIONAL PURPOSES. MARKPLEX CORPORATION. DOES NOT RECOMMEND THAT YOU USE ANY SUCH TRADING STRATEGIES, SIGNALS, STUDIES, INDICATORS, SHOWME STUDIES, PAINTBAR STUDIES, PROBABILITYMAP STUDIES, ACTIVITYBAR STUDIES, FUNCTIONS (OR ANY PARTS THEREOF) OR TECHNIQUES. THE USE OF ANY SUCH TRADING STRATEGIES, SIGNALS, STUDIES, INDICATORS, SHOWME STUDIES, PAINTBAR STUDIES, PROBABILITYMAP STUDIES, ACTIVITYBAR STUDIES, FUNCTIONS AND TECHNIQUES DOES NOT GUARANTEE THAT YOU WILL MAKE PROFITS, INCREASE PROFITS, OR MINIMIZE LOSSES.
Step 1
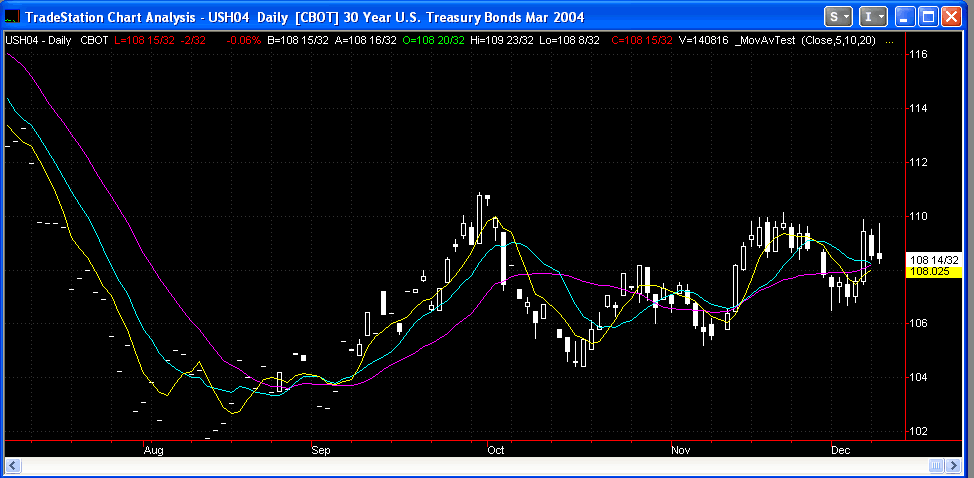
The following shows a daily chart with the TradeStation’s Mov Avg 3 Line indicator added.
Step 2
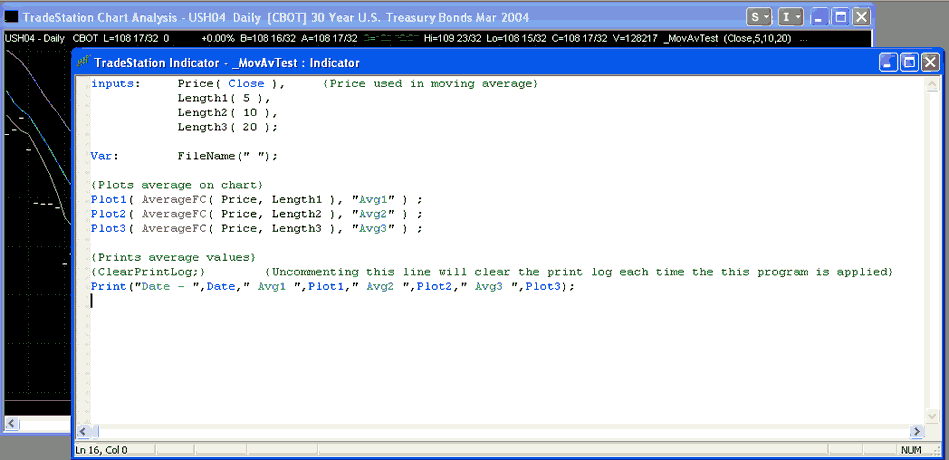
In order to create the same plot and capture information to the print log open a new EasyLanguage window (see tutorial 1 or 2 for more details) and enter the following:
When you have finished, click the green arrow on the icon bar at the top of the screen to verify the EasyLanguage document (alternatively, you can press the F3 key or click Tools – Verify.) Having done so, apply the new indicator to an open daily chart (to do so press ALT – C). Having applied the indicator, click Format – Analysis Techniques and select the indicator name that you have just created and inserted into the chart. Click the Format button and make sure that the Update Value Intrabar is not selected. This will ensure that the information is not reprinted every tick.
Having applied the indicator, make sure View – EasyLanguage Output Bar is selected. Under the chart you should see an area with 3 tabs. Select PrintLog and you should be able to see the information that you have just specified in the indicator. It should look something like:
Date – 1031104.00 Avg1 107.05 Avg2 107.23 Avg3 106.55
Notice that the date is in a strange EasyLanguage format. Year comes first with 103 = 2003. Next comes month and finally day.
Step 3
In step 3 we will improve the formatting for the print log by modifying the print line. See below:

If you make these changes you should see that the output now looks as follows:
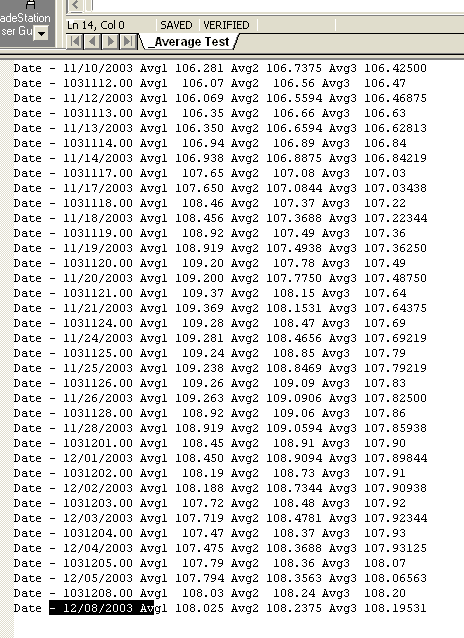
The change to the date is self explanatory. You should also notice the the number of decimal places changes depending on the figure after the second colon. For example, Plot3:3:5 produces a number with 5 decimal places.
It would be possible to simply copy and paste the information in the print log into another program, such as Microsoft Excel, for analysis, however in step 4 I will show you another approach to this.
Step 4
Modify the indicator you have already created so that it matches the following:
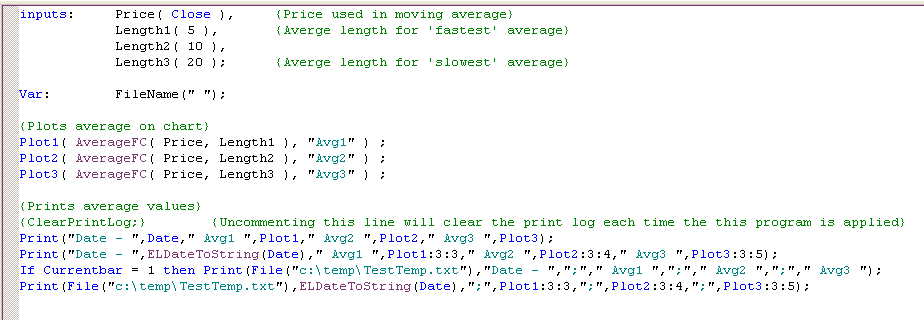
You will notice that I have added 2 new lines at the end of the indicator. Before you verify this indicator, be sure to check that you have a C:temp directory on your hard drive and that you DO NOT have a TestTemp.txt file that you (or one of your programs) is using for another purpose. You can modify the c:tempTestTemp.txt statement to create a file in the place on your directory structure where you would like to place it.
The first new line prints a title line to the file when Currentbar = 1, i.e. it only prints the titles once. The next line does pretty much what the print line that we created earlier does, with 2 exceptions.
Firstly is print to a file (c:tempTestTemp.txt) rather than the print log. Secondly, it add some semicolons between data items. You will see what these do in the next few steps.
Step 5
Having made the changes described in step 4 and verified the indicator, you should find that you have created a text file (c:tempTestTemp.txt).
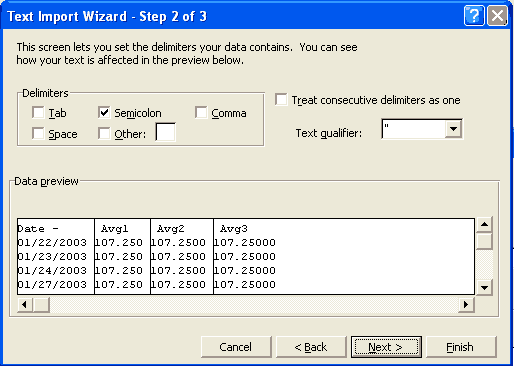
To check this, open Microsoft Excel and open a file. Make sure that the file type is set to .txt and that you are looking in the correct directory. When you open the file, Excel should take you into a Test Import Wizard. Follow through the steps and in Step 2, make sure that you select the options as shown below.
Step 6
If you have done everything correctly you should see an Excel spreadsheet wit the following information contained within it. Voila!
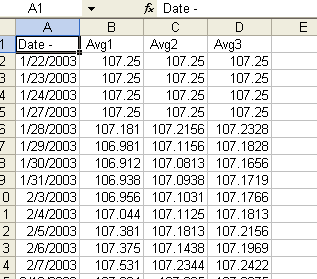
You can now analyze and format the data to your own requirements.