
Welcome to tutorial 48 in this series of tutorials designed to teach EasyLanguage programming skills. This tutorial applies to TradeStation 8.7 and newer versions, as well as to MultiCharts.
In this tutorial we create and test a show me study that creates a line using linear regression that best fits chart data. The linear regression method used in this tutorial uses the least squares method to calculate the slope and y-intercept of this line.
The formulae we use are as follows:
Slope(m) = ( NΣXY – ( ΣX )( ΣY ) ) / ( NΣX2 – ( ΣX )2 )
Intercept(c) = ( ΣY – m( ΣX ) ) / N
Equation(y) = mx + c
Where the ‘Σ‘ symbol means ‘sum.’
In the tutorial, we first get closing data for the most recent ten bars. We then use the above formulae to calculate the slope and y intercept using a spreadsheet. We finally demonstrate the calculation in TradeStation and draw a line.
Click here to download a copy of the program created in this tutorial:
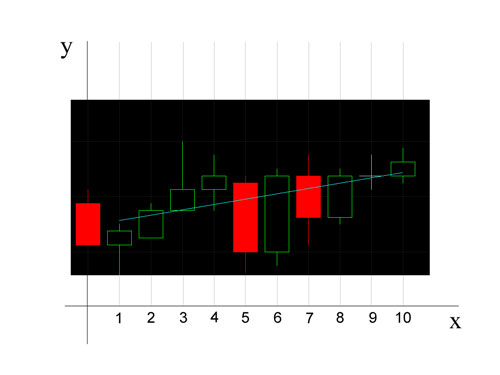
The above graph shows a part of a TradeStation chart applied over an x – y graph.
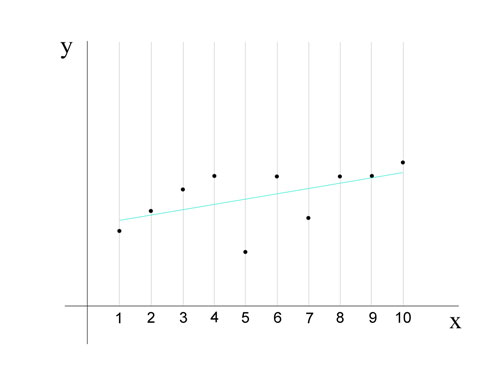
This graph is the same as the previous one except it just shows the closing values
Please join our email mailing list if you have not already done so and we will let you know when we release new tutorials or programs.
Tutorial 48 Video 1 – Introduction to linear regression formulae and spreadsheet calculation
Click here to download a copy of the program created in this tutorial for $14.95:
Tutorial 48 Video 2 – Calculate slope and y intercept and draw line on chart
Click here to download a copy of the program created in this tutorial for $14.95:
If you see any errors in this tutorial – or we have not made something clear, we would be most grateful if you could please let us know. E-mail us at: tutorials@markplex.com. Also, let us know if you have any ideas for new tutorials.
EasyLanguage is a programming language that is part of the TradeStation trading platform. It can be used to write programs to help in the technical analysis and trading of foreign exchange (forex or FX), commodities (e.g. the Dow e-mini, S&P e-mini etc), options, and stocks.
TO THE BEST OF MARKPLEX CORPORATION’S KNOWLEDGE, ALL OF THE INFORMATION ON THIS PAGE IS CORRECT, AND IT IS PROVIDED IN THE HOPE THAT IT WILL BE USEFUL. HOWEVER, MARKPLEX CORPORATION ASSUMES NO LIABILITY FOR ANY DAMAGES, DIRECT OR OTHERWISE, RESULTING FROM THE USE OF THIS INFORMATION AND/OR PROGRAM(S) DESCRIBED, AND NO WARRANTY IS MADE REGARDING ITS ACCURACY OR COMPLETENESS. USE OF THIS INFORMATION AND/OR PROGRAMS DESCRIBED IS AT YOUR OWN RISK.
ANY EASYLANGUAGE OR POWERLANGUAGE TRADING STRATEGIES, SIGNALS, STUDIES, INDICATORS, SHOWME STUDIES, PAINTBAR STUDIES, PROBABILITYMAP STUDIES, ACTIVITYBAR STUDIES, FUNCTIONS (AND PARTS THEREOF) AND ASSOCIATED TECHNIQUES REFERRED TO, INCLUDED IN OR ATTACHED TO THIS TUTORIAL OR PROGRAM DESCRIPTION ARE EXAMPLES ONLY, AND HAVE BEEN INCLUDED SOLELY FOR EDUCATIONAL PURPOSES. MARKPLEX CORPORATION. DOES NOT RECOMMEND THAT YOU USE ANY SUCH TRADING STRATEGIES, SIGNALS, STUDIES, INDICATORS, SHOWME STUDIES, PAINTBAR STUDIES, PROBABILITYMAP STUDIES, ACTIVITYBAR STUDIES, FUNCTIONS (OR ANY PARTS THEREOF) OR TECHNIQUES. THE USE OF ANY SUCH TRADING STRATEGIES, SIGNALS, STUDIES, INDICATORS, SHOWME STUDIES, PAINTBAR STUDIES, PROBABILITYMAP STUDIES, ACTIVITYBAR STUDIES, FUNCTIONS AND TECHNIQUES DOES NOT GUARANTEE THAT YOU WILL MAKE PROFITS, INCREASE PROFITS, OR MINIMIZE LOSSES.