This tutorial takes the standard Commodity Channel Indicator (CCI) provided by TradeStation and modifies it to include fast and slow CCIs together with a zero line. We also add a histogram under the slow CCI. In future tutorials I will show you how to create indicators based on the CCI, such as ‘zero rejections’ etc
TO THE BEST OF MARKPLEX CORPORATION’S KNOWLEDGE, ALL OF THE INFORMATION ON THIS PAGE IS CORRECT, AND IT IS PROVIDED IN THE HOPE THAT IT WILL BE USEFUL. HOWEVER, MARKPLEX CORPORATION ASSUMES NO LIABILITY FOR ANY DAMAGES, DIRECT OR OTHERWISE, RESULTING FROM THE USE OF THIS INFORMATION AND/OR PROGRAM(S) DESCRIBED, AND NO WARRANTY IS MADE REGARDING ITS ACCURACY OR COMPLETENESS. USE OF THIS INFORMATION AND/OR PROGRAMS DESCRIBED IS AT YOUR OWN RISK.
ANY EASYLANGUAGE OR POWERLANGUAGE TRADING STRATEGIES, SIGNALS, STUDIES, INDICATORS, SHOWME STUDIES, PAINTBAR STUDIES, PROBABILITYMAP STUDIES, ACTIVITYBAR STUDIES, FUNCTIONS (AND PARTS THEREOF) AND ASSOCIATED TECHNIQUES REFERRED TO, INCLUDED IN OR ATTACHED TO THIS TUTORIAL OR PROGRAM DESCRIPTION ARE EXAMPLES ONLY, AND HAVE BEEN INCLUDED SOLELY FOR EDUCATIONAL PURPOSES. MARKPLEX CORPORATION. DOES NOT RECOMMEND THAT YOU USE ANY SUCH TRADING STRATEGIES, SIGNALS, STUDIES, INDICATORS, SHOWME STUDIES, PAINTBAR STUDIES, PROBABILITYMAP STUDIES, ACTIVITYBAR STUDIES, FUNCTIONS (OR ANY PARTS THEREOF) OR TECHNIQUES. THE USE OF ANY SUCH TRADING STRATEGIES, SIGNALS, STUDIES, INDICATORS, SHOWME STUDIES, PAINTBAR STUDIES, PROBABILITYMAP STUDIES, ACTIVITYBAR STUDIES, FUNCTIONS AND TECHNIQUES DOES NOT GUARANTEE THAT YOU WILL MAKE PROFITS, INCREASE PROFITS, OR MINIMIZE LOSSES.
The standard CCI indicator provided by TradeStation will produce a plot similar to the following when added to a chart:
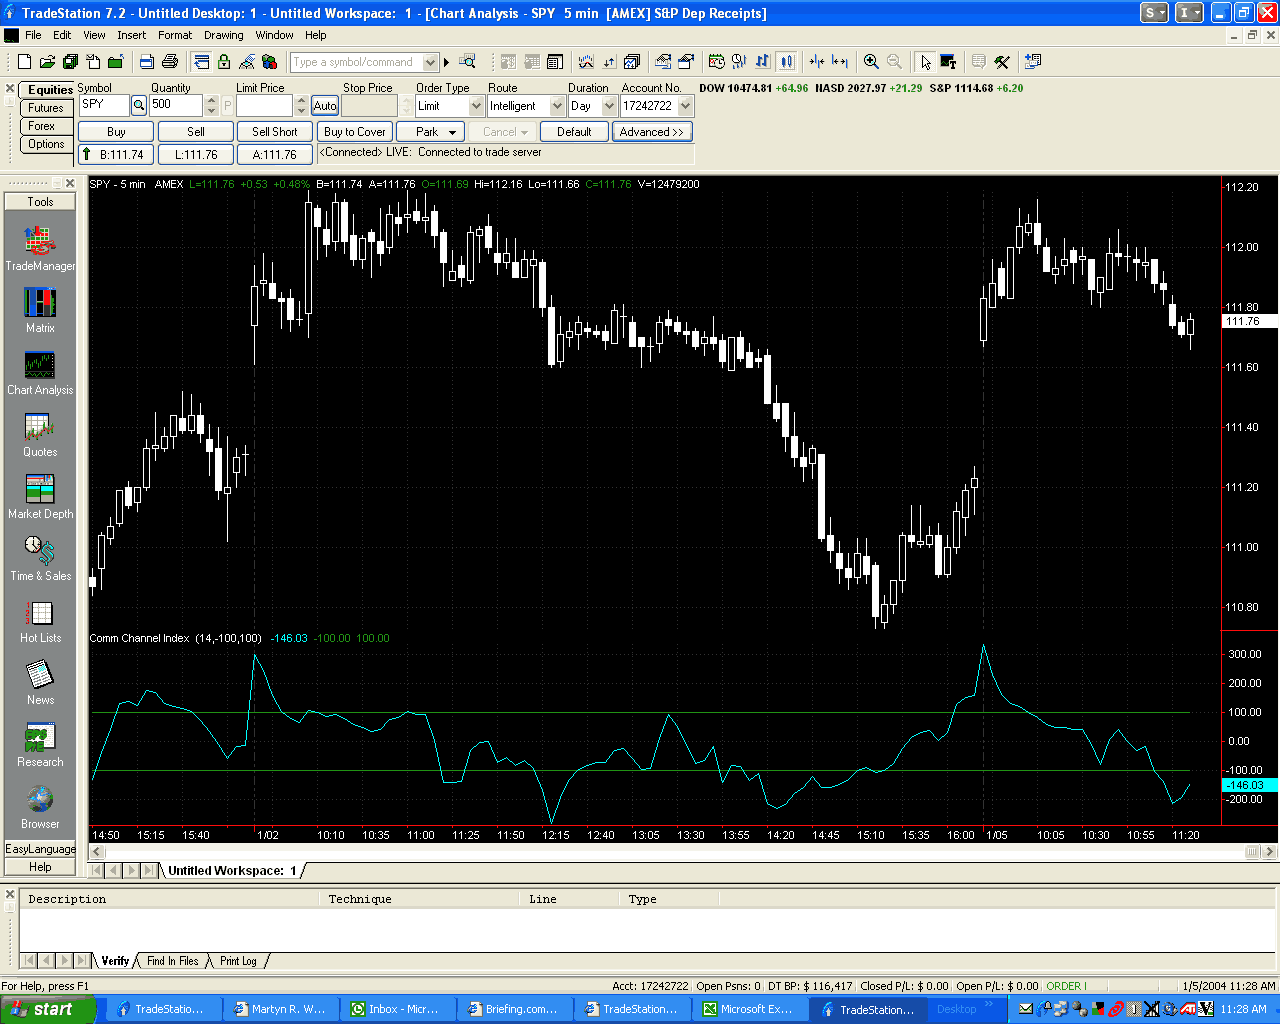
This tutorial will add an additional CCI plot with a different period, together with a zero line.
Step 1
Create a new EasyLanguage document (to do this, open your copy of TradeStation and click File – New – Window on the top menu bar. Then select the EasyLanguage tab and double click on Indicator. Give the new indicator a name – I suggest that you prefix this name with the “_” character so that you will be able to distinguish your indicator from TradeStation’s built-in indicators).
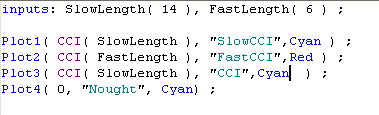
Type in the following program:
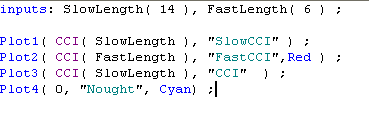
The program uses 2 inputs. SlowLength is used as the parameter for the normal CCI plot. FastLength is used as the parameter for the faster CCI plot.
The indicator includes 4 plots. Plot 1 is the CCI with the length entered as slow length. Plot 2 is the CCI using the fast length parameter. Plot 3 is similar to Plot 1; I will explain why I have repeated this later in the tutorial. Plot 4 is the zero line.
Step 2
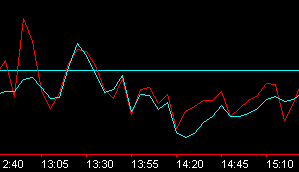
Open a new chart and insert the indicator you have just created into the chart (Insert-Indicator). The indicator should appear something like the following screen-shot:
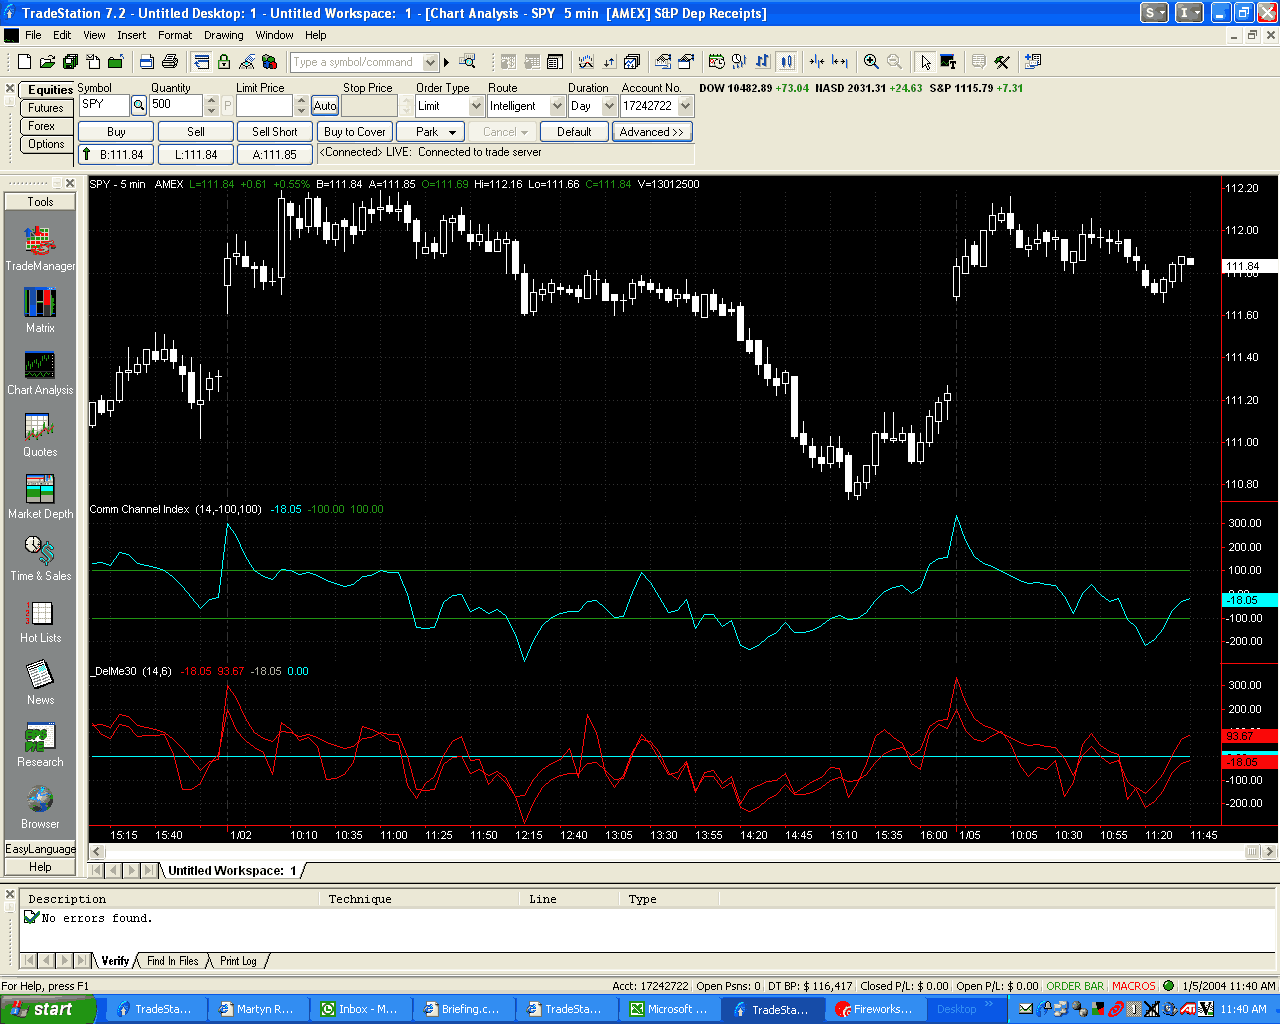
Notice that that plots 1-3 are all appearing in red and are difficult to distinguish from each other. We will rectify this in Step 3.
Step 3
Modify the color of Plot 1 and Plot 3 to a new color. I have used Cyan.
Step 4
Having made the chance, the plot should now appear as follows:
Notice that Plot 1 and Plot 3 are indistinguishable. To make Plot 3 appear as a histogram type plot, we need to take an additional step.
Step 5
Double click on the indicator appearing on the chart. The format indicator box should appear as follows:
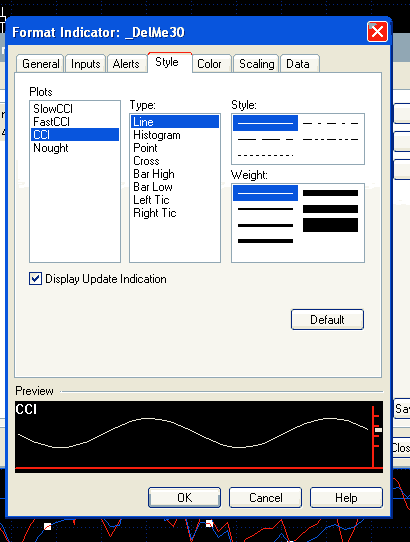
Click on the Style tab. Select the plot labeled ‘CCI’. This corresponds to Plot 3
Step 6
Click the Histogram option.
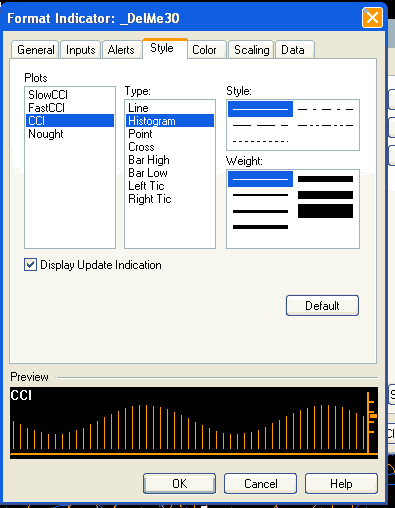
and the plot should now appear as follows:
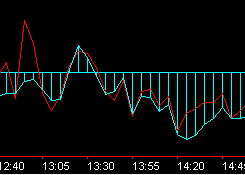
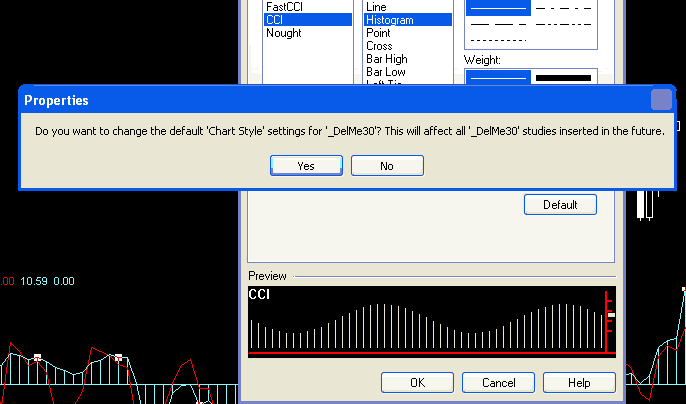
Step 7
In order to ensure that this change is applied whenever the indicator is used, click the default button. The confirmation window will appear as shown in the screen shot. Confirm this by clicking the ‘yes’ button.
Whenever you use this indicator in the future, you should see the same plots as illustrated in Step 6.