

See updated version below.
This tutorial demonstrates how to create an EasyLanguage ShowMe study where the highest high and lowest low are determined between two times (‘evaluation zone’) and lines are drawn at these levels. Subsequently, (at least until a new channel is drawn) the program alerts the user if the lines are crossed.
The tutorial demonstrates a technique for finding the highest and lowest values between two times, as well as how to draw lines and set alerts programmatically. It also explains how to reset certain variables after the lines have been drawn.
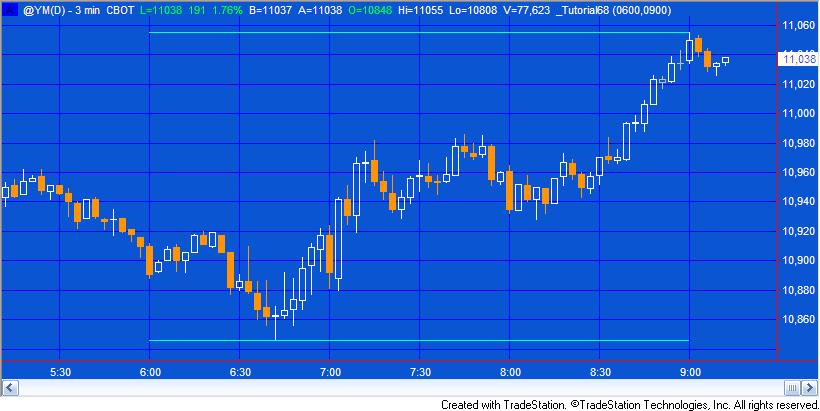
The image below shows the tutorial show-me study applied to a 3 minute @YM(D) chart.
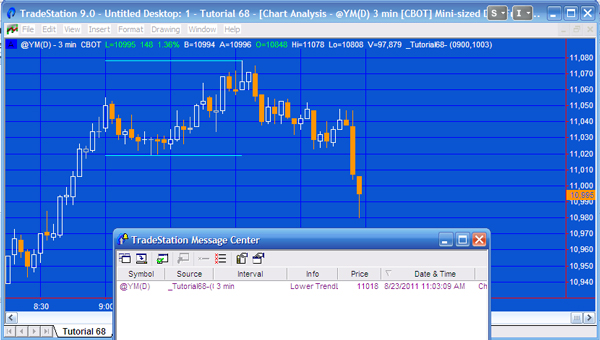
The image below shows the tutorial show-me study applied to a 3 minute @YM(D) chart with an alert.
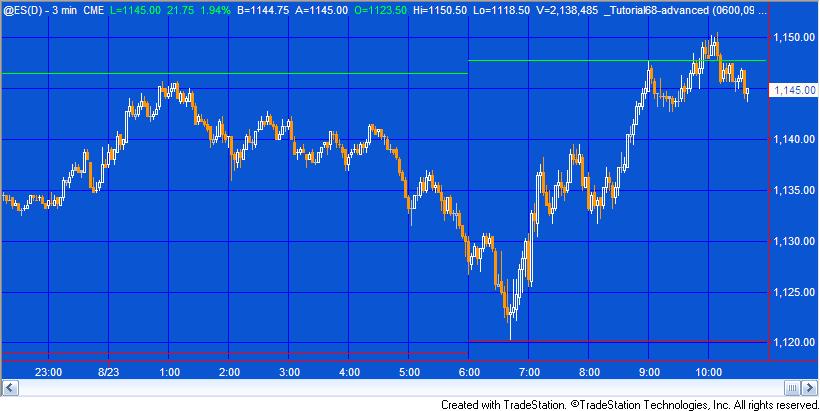
The image below shows the more advanced show-me study (available with the download – see below) applied to a 3 minute @YM(D) chart. Notice the horizontal lines continue until the start time of the new channel.
A video below explains the tutorial in more detail.
Tutorial 68 Video - Creating a timed High-Low range show-me study
New Version
Since posting the original tutorial, I received several suggestions that I create a new version that:
- Shows the actual value of the lines in text
- Plots a middle line between the ‘high’ and ‘low’ lines
- Gives the the options to just draw lines for today or for each day on the chart
- Gives the option to extend the lines or not
Creating such a program includes several challenges including whether to include the text values after each channel is concluded and then move them to a new position every bar, or whether historically to just draw the values at the starttime of the next day and only move the text values for the current day. The program includes many such techniques which hopefully you will find useful.
I have decided to bundle this new program in with the earlier versions that were included with this tutorial.
Tutorial 68 is designed for charts with a minute interval type.
Video Part 2
Please join our email mailing list if you have not already done so and we will let you know when we release new tutorials or programs.
TO THE BEST OF MARKPLEX CORPORATION’S KNOWLEDGE, ALL OF THE INFORMATION ON THIS PAGE IS CORRECT, AND IT IS PROVIDED IN THE HOPE THAT IT WILL BE USEFUL. HOWEVER, MARKPLEX CORPORATION ASSUMES NO LIABILITY FOR ANY DAMAGES, DIRECT OR OTHERWISE, RESULTING FROM THE USE OF THIS INFORMATION AND/OR PROGRAM(S) DESCRIBED, AND NO WARRANTY IS MADE REGARDING ITS ACCURACY OR COMPLETENESS. USE OF THIS INFORMATION AND/OR PROGRAMS DESCRIBED IS AT YOUR OWN RISK.
ANY EASYLANGUAGE OR POWERLANGUAGE TRADING STRATEGIES, SIGNALS, STUDIES, INDICATORS, SHOWME STUDIES, PAINTBAR STUDIES, PROBABILITYMAP STUDIES, ACTIVITYBAR STUDIES, FUNCTIONS (AND PARTS THEREOF) AND ASSOCIATED TECHNIQUES REFERRED TO, INCLUDED IN OR ATTACHED TO THIS TUTORIAL OR PROGRAM DESCRIPTION ARE EXAMPLES ONLY, AND HAVE BEEN INCLUDED SOLELY FOR EDUCATIONAL PURPOSES. MARKPLEX CORPORATION. DOES NOT RECOMMEND THAT YOU USE ANY SUCH TRADING STRATEGIES, SIGNALS, STUDIES, INDICATORS, SHOWME STUDIES, PAINTBAR STUDIES, PROBABILITYMAP STUDIES, ACTIVITYBAR STUDIES, FUNCTIONS (OR ANY PARTS THEREOF) OR TECHNIQUES. THE USE OF ANY SUCH TRADING STRATEGIES, SIGNALS, STUDIES, INDICATORS, SHOWME STUDIES, PAINTBAR STUDIES, PROBABILITYMAP STUDIES, ACTIVITYBAR STUDIES, FUNCTIONS AND TECHNIQUES DOES NOT GUARANTEE THAT YOU WILL MAKE PROFITS, INCREASE PROFITS, OR MINIMIZE LOSSES.
If you see any errors in this tutorial – or we have not made something clear, we would be most grateful if you could please let us know. E-mail us at: tutorials@markplex.com. Also, let us know if you have any ideas for new tutorials.
EasyLanguage is a programming language that is part of the TradeStation trading platform. It can be used to write programs to help in the technical analysis and trading of foreign exchange (forex or FX), commodities (e.g. the Dow e-mini, S&P e-mini etc), options, and stocks.