
In tutorial 88 I explain how to use a price series provider (PriceSeriesProvider or PSP) in an indicator to calculate and plot the Average Directional Index (ADX) of a 30 minute bar on a 5 minute bar chart. In order to keep the concepts as clear as possible, I have omitted some functionality that helps the calculation ‘converge’ more quickly to what it would be if it had been applied to a very large number of bars. This just effects the bars at the start of the chart which I demonstrate in the video.
Gold Pass members can copy and paste the tutorial program created in the video below.
This tutorial program is also available for immediate download for only $39.95. This tutorial applies to TradeStation (but not MultiCharts) because it uses some of TradeStation’s object oriented extensions.
30 Minute ADX using PriceSeriesProvider
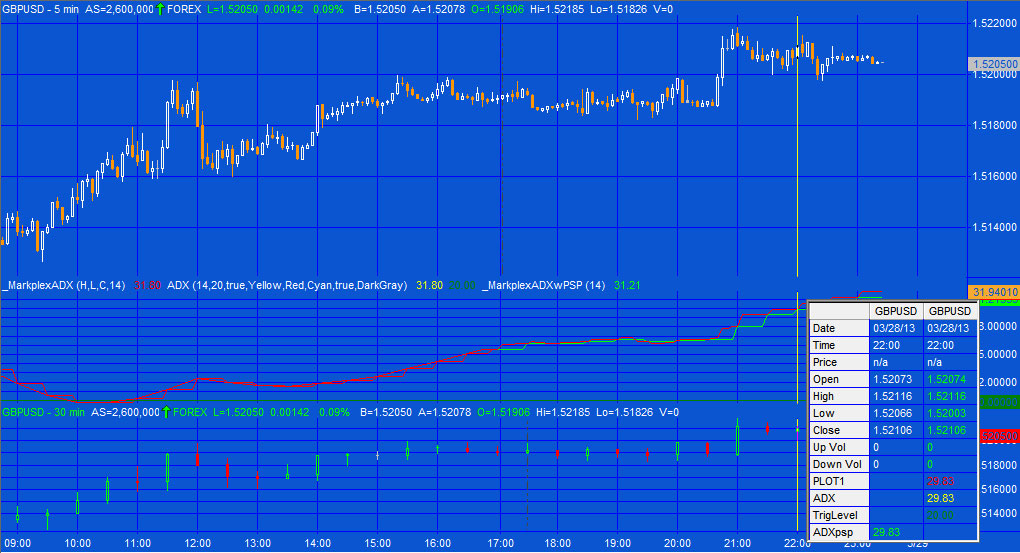
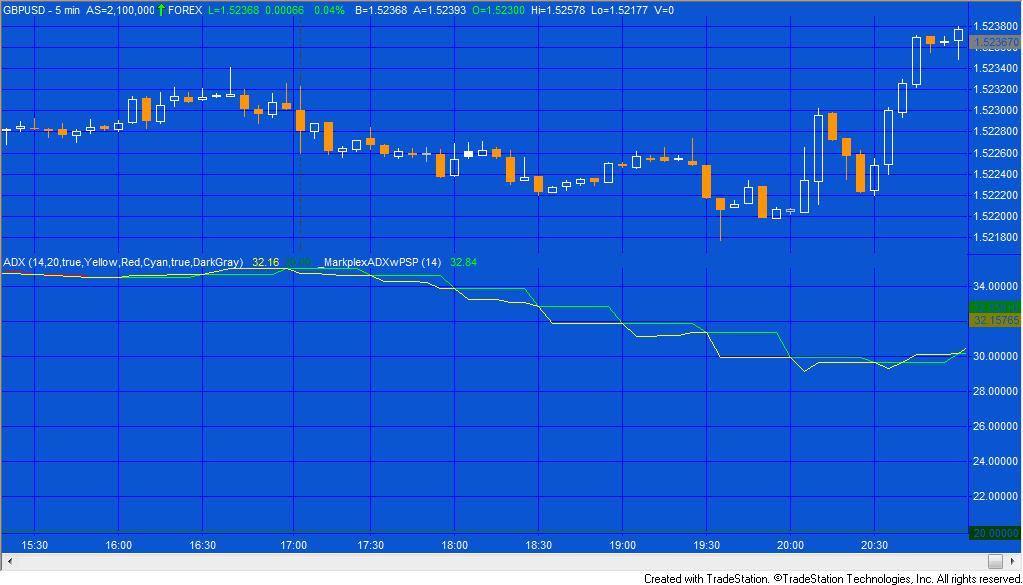
The EasyLanguage indicator is applied to the lower time frame (and hence runs on every 5 minute bar), however we actually only want to perform the ADX calculation at the end of each 30 minute bar. This means that we have to find some way of ‘firing’ the calculation at the end of the virtual 30 minute bar. We also need to refer to values that were calculated in the previous virtual 30 minute bar. Another issue is that, similar to tutorial 86 and 87) the historical plot behaves differently from the real time plot.
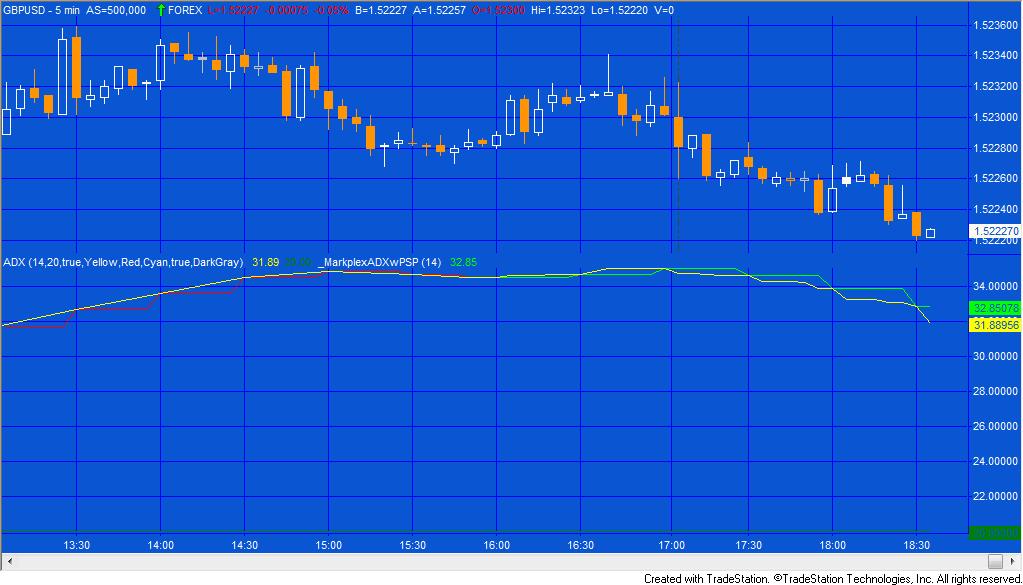
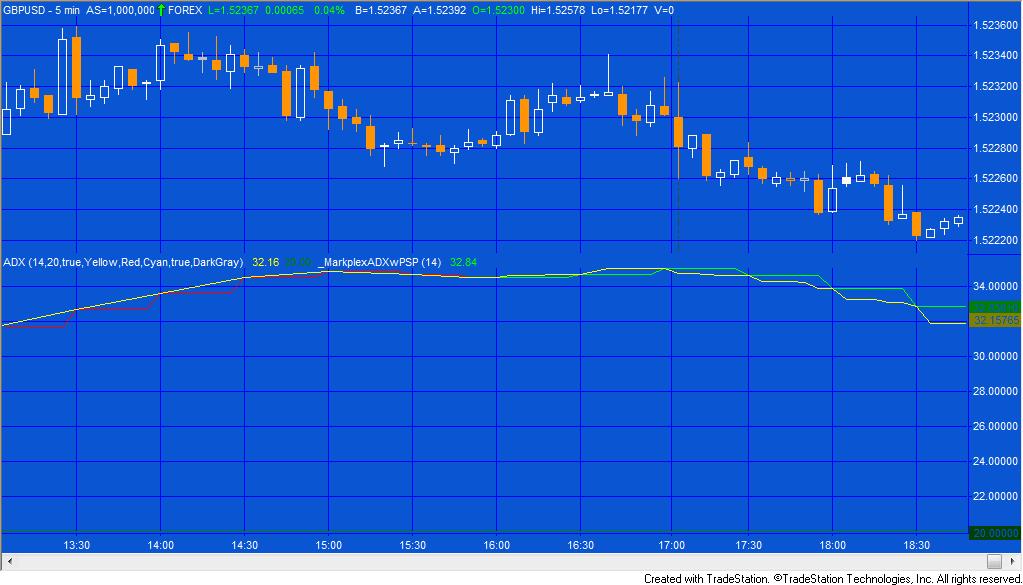
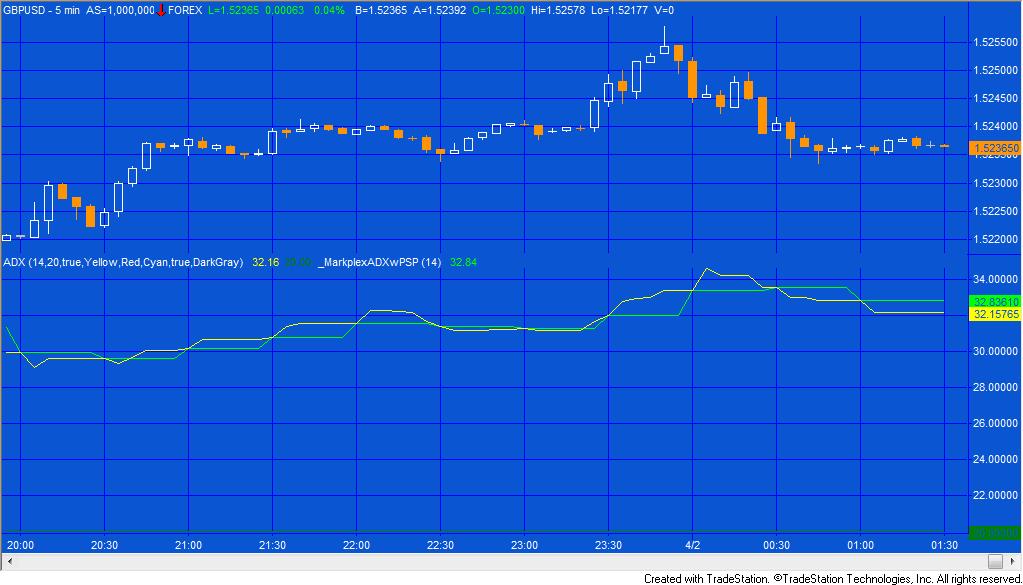
The program plots the ‘real time’ ADX in a different color from the historically calculated ADX. I have also plotted the same exponential moving average calculated using data 2 set up as 30 minute GBPUSD bars.
To create a price series provider, I dragged the PriceSeriesProvider from the tool box onto my program workspace. I do some initial setup using the properties tab including, in this case, double clicking the events button followed by the word: ‘Updated.’ I then copy the code from the ‘designer generated code’ and copy it into the program and make some adjustments. You can find more details about this process by studying tutorial 87.
Gold Pass members can copy and paste the tutorial program created in the videos below.
Video explanation | How to calculate an ADX using a price series provider and update event
This tutorial program is also available for immediate download for only $39.95. This tutorial applies to TradeStation (but not MultiCharts) because it uses some of TradeStation’s object oriented extensions.
If you are are a Gold Pass member I have included a copy of this demonstration program below, make sure you are logged in to see the following content:
In the video above, the program is applied to symbol GBPUSD.
THESE INDICATORS, SHOW ME STUDIES, STRATEGIES AND OTHER PROGRAMS HAVE BEEN INCLUDED SOLELY FOR EDUCATIONAL PURPOSES.
TO THE BEST OF MARKPLEX CORPORATION’S KNOWLEDGE, ALL OF THE INFORMATION ON THIS PAGE IS CORRECT, AND IT IS PROVIDED IN THE HOPE THAT IT WILL BE USEFUL. HOWEVER, MARKPLEX CORPORATION ASSUMES NO LIABILITY FOR ANY DAMAGES, DIRECT OR OTHERWISE, RESULTING FROM THE USE OF THIS INFORMATION AND/OR PROGRAM(S) DESCRIBED, AND NO WARRANTY IS MADE REGARDING ITS ACCURACY OR COMPLETENESS. USE OF THIS INFORMATION AND/OR PROGRAMS DESCRIBED IS AT YOUR OWN RISK.
ANY EASYLANGUAGE OR POWERLANGUAGE TRADING STRATEGIES, SIGNALS, STUDIES, INDICATORS, SHOWME STUDIES, PAINTBAR STUDIES, PROBABILITYMAP STUDIES, ACTIVITYBAR STUDIES, FUNCTIONS (AND PARTS THEREOF) AND ASSOCIATED TECHNIQUES REFERRED TO, INCLUDED IN OR ATTACHED TO THIS TUTORIAL OR PROGRAM DESCRIPTION ARE EXAMPLES ONLY, AND HAVE BEEN INCLUDED SOLELY FOR EDUCATIONAL PURPOSES. MARKPLEX CORPORATION. DOES NOT RECOMMEND THAT YOU USE ANY SUCH TRADING STRATEGIES, SIGNALS, STUDIES, INDICATORS, SHOWME STUDIES, PAINTBAR STUDIES, PROBABILITYMAP STUDIES, ACTIVITYBAR STUDIES, FUNCTIONS (OR ANY PARTS THEREOF) OR TECHNIQUES. THE USE OF ANY SUCH TRADING STRATEGIES, SIGNALS, STUDIES, INDICATORS, SHOWME STUDIES, PAINTBAR STUDIES, PROBABILITYMAP STUDIES, ACTIVITYBAR STUDIES, FUNCTIONS AND TECHNIQUES DOES NOT GUARANTEE THAT YOU WILL MAKE PROFITS, INCREASE PROFITS, OR MINIMIZE LOSSES.