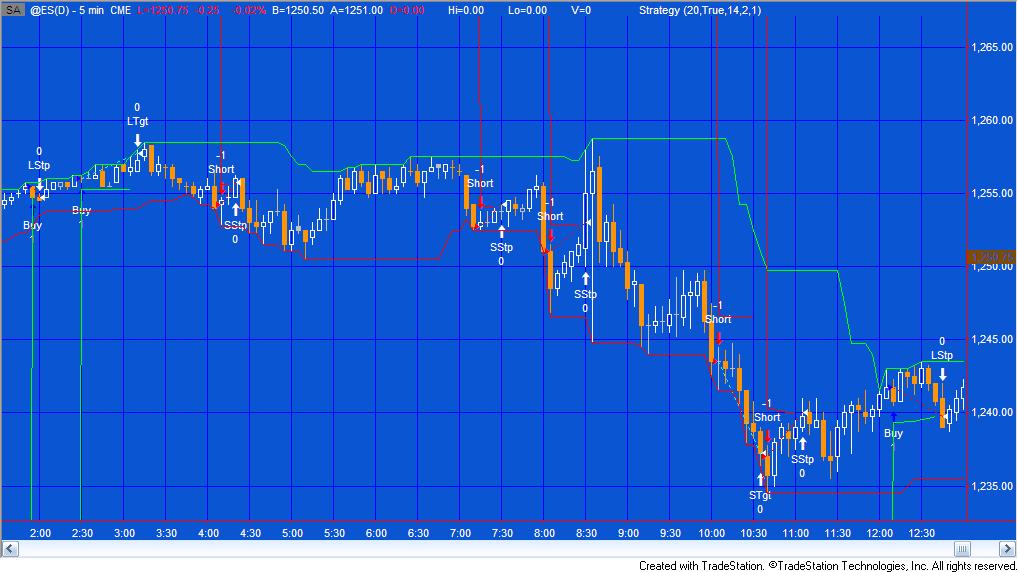
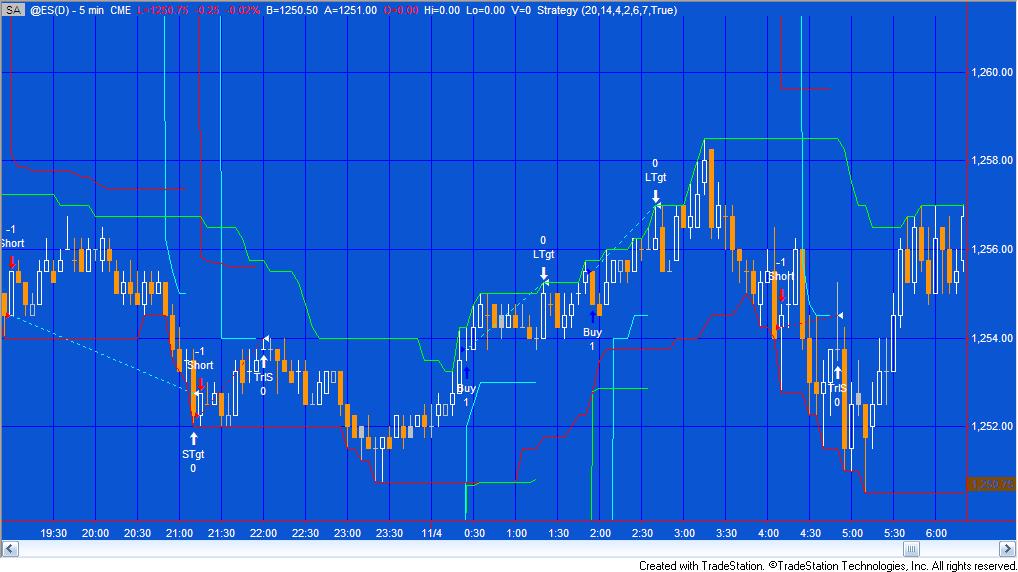
In this tutorial I demonstrate how to create a simple breakout strategy together with a target, stop and trailing stop. The target and the stop are based on a multiple of the average true range (ATR). The tutorial also shows a way of drawing the various levels on the chart to help you visualize what is happening.

Since the ATR value varies, so does the target value. With the stop I demonstrate how to ensure that the stop gets ‘tighter’ even if the ATR increases in value.
The trailing stop is based a multiple of the minimum move of the instrument on the chart. The trailing stop functionality looks for price to move a certain distance from the entry price before starting to trail by a user defined amount.

Once the parameters look correct, I recommend that you turn off the drawing objects by making the user input: DrawLines equal to false. The drawing objects are drawn using the TL_new reserved word. Although some of the lines look like continuous plots, in reality they are made up of many tiny straight line segments.
The product is available for immediate download for $39.95.
Inputs
ExtremeLength( 20 ), // The number of bars over which highest high is calculated
ATRLength( 14 ), // The number of bars over which lowest low is calculated
StopATR( 2 ), // Multiple of ATR used to calculate stop value
TgtATR( 2 ), // Multiple of ATR used to calculate target value
TrlKickIn( 10 ), // Price must move in this number of ticks from entry price for the trail to start
TrlAmt( 5 ), // How much the trailing stop trails by
DrawLines( True ); // If set to TRUE lines are drawn on chart for channel, stops, and trailing stops
The product is available for immediate download for $39.95.
Video 1 | Creating the breakout channel and calculating stops and targets
Video 2 | Calculating and drawing the trailing stops
The product is available for immediate download for $39.95.
Please email me at martyn.whittaker@markplex.com if you spot any bugs or errors.
TO THE BEST OF MARKPLEX CORPORATION’S KNOWLEDGE, ALL OF THE INFORMATION ON THIS PAGE IS CORRECT, AND IT IS PROVIDED IN THE HOPE THAT IT WILL BE USEFUL. HOWEVER, MARKPLEX CORPORATION ASSUMES NO LIABILITY FOR ANY DAMAGES, DIRECT OR OTHERWISE, RESULTING FROM THE USE OF THIS INFORMATION AND/OR PROGRAM(S) DESCRIBED, AND NO WARRANTY IS MADE REGARDING ITS ACCURACY OR COMPLETENESS. USE OF THIS INFORMATION AND/OR PROGRAMS DESCRIBED IS AT YOUR OWN RISK.
ANY EASYLANGUAGE OR POWERLANGUAGE TRADING STRATEGIES, SIGNALS, STUDIES, INDICATORS, SHOWME STUDIES, PAINTBAR STUDIES, PROBABILITYMAP STUDIES, ACTIVITYBAR STUDIES, FUNCTIONS (AND PARTS THEREOF) AND ASSOCIATED TECHNIQUES REFERRED TO, INCLUDED IN OR ATTACHED TO THIS TUTORIAL OR PROGRAM DESCRIPTION ARE EXAMPLES ONLY, AND HAVE BEEN INCLUDED SOLELY FOR EDUCATIONAL PURPOSES. MARKPLEX CORPORATION. DOES NOT RECOMMEND THAT YOU USE ANY SUCH TRADING STRATEGIES, SIGNALS, STUDIES, INDICATORS, SHOWME STUDIES, PAINTBAR STUDIES, PROBABILITYMAP STUDIES, ACTIVITYBAR STUDIES, FUNCTIONS (OR ANY PARTS THEREOF) OR TECHNIQUES. THE USE OF ANY SUCH TRADING STRATEGIES, SIGNALS, STUDIES, INDICATORS, SHOWME STUDIES, PAINTBAR STUDIES, PROBABILITYMAP STUDIES, ACTIVITYBAR STUDIES, FUNCTIONS AND TECHNIQUES DOES NOT GUARANTEE THAT YOU WILL MAKE PROFITS, INCREASE PROFITS, OR MINIMIZE LOSSES.

