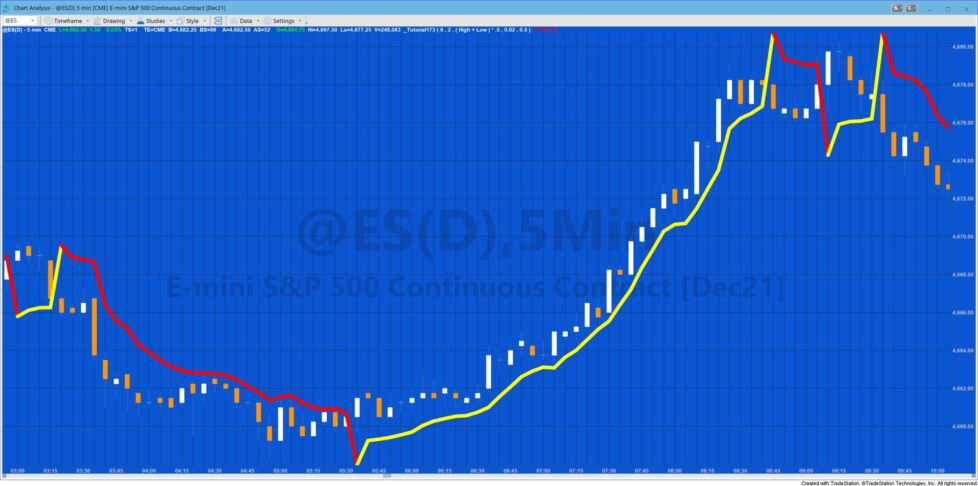
Tutorial 173 | SuperTrend indicator is a stop and reverse (SAR) indicator that trails price action. This implementation calculates the Average True Range (ATR) of the average price using the exponential moving average. A user input multiple of the ATR is added to or subtracted from the average price to give Upper and Lwr
respectively, depending on the direction. Direction is determined by the Close of a bar relative to the value of the SuperTrend, Upper and Lwr using the following code:
If C > SupTrend then
Begin
Dir = 1;
PlotColor = Yellow;
//Print( " C > ST c ",c," SupTrend ", SupTrend," ",BarColor);
End
else if C < SupTrend then
Begin
Dir = -1;
PlotColor = Red;
// Print( "C <= ST "," ",BarColor );
End;
When the direction is up (Dir = 1), the SupTrend value can only increase. When the dirction is down, the SupTrend can only decrease.
There are many different interpretations of the so-called SuperTrend indicator. In this Markplex version the SuperTrend value is also tightened (i.e. moved closer to price) by using an acceleration factor which increases incrementally each bar by user input: AFStep up to a a maximum value of user input: MaxAF.
The indicator works best in trending markets but gets ‘whipsawed’ in other markets.
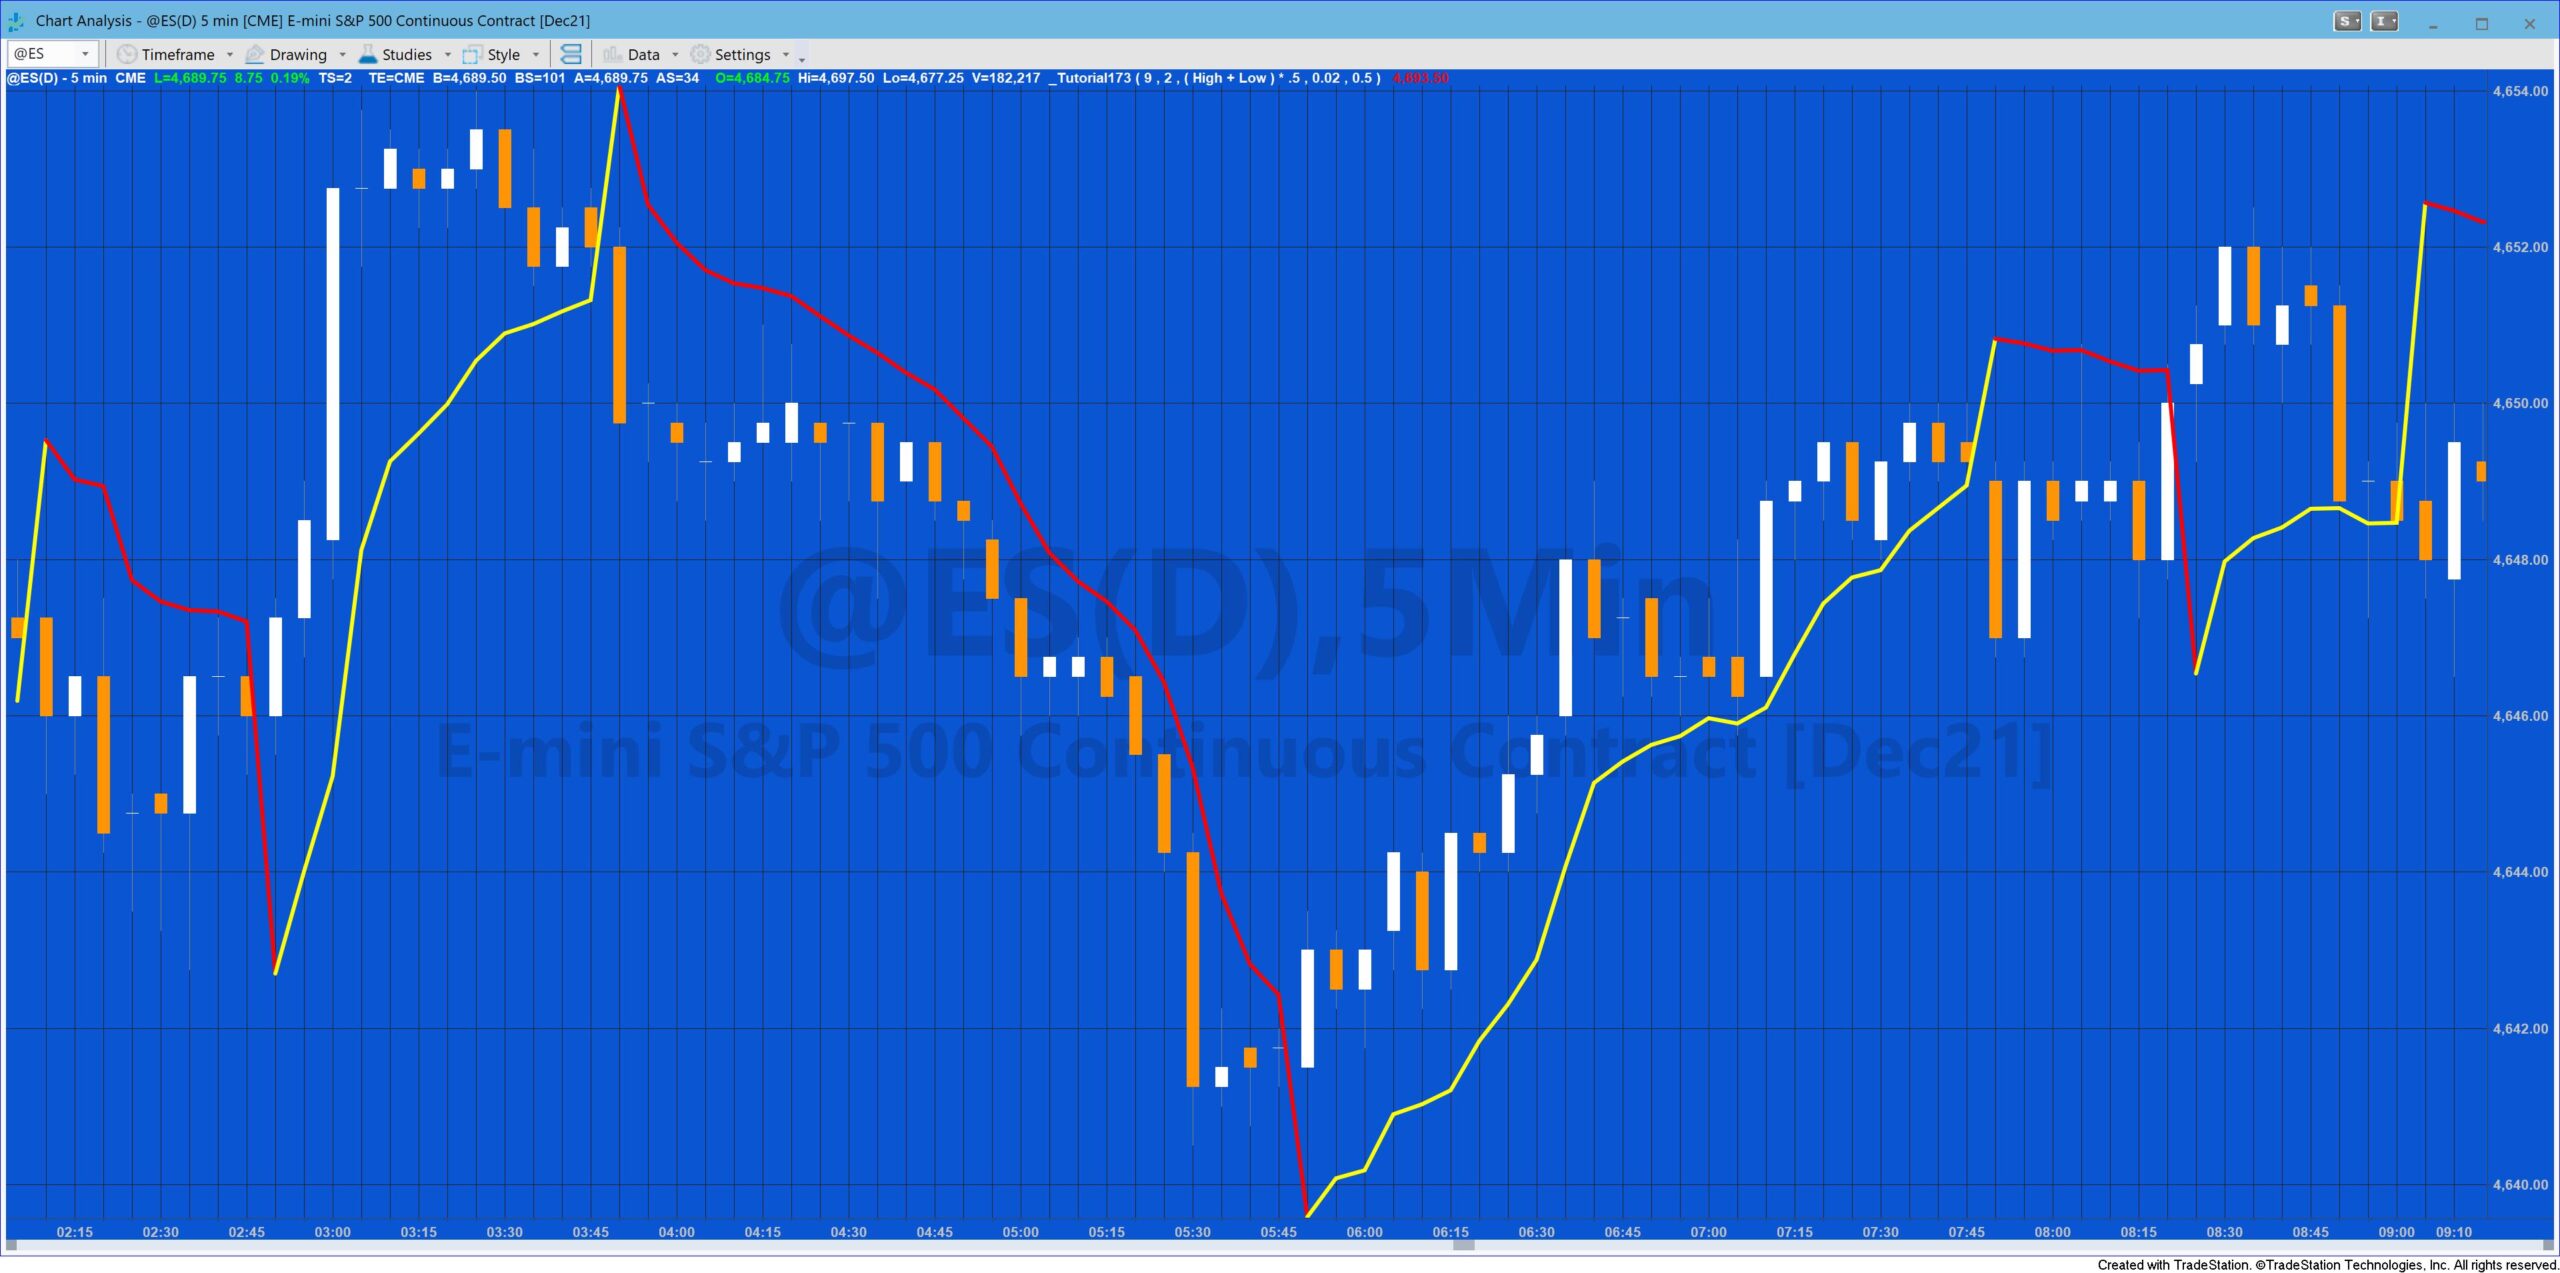
Download the tutorial 173 TradeStation EasyLanguage indicator
The download consists of _Tutorial173 (the TradeStation EasyLanguage indicator developed in the tutorial).
See tutorial 43 which demonstrates how to import an ELD into TradeStation.
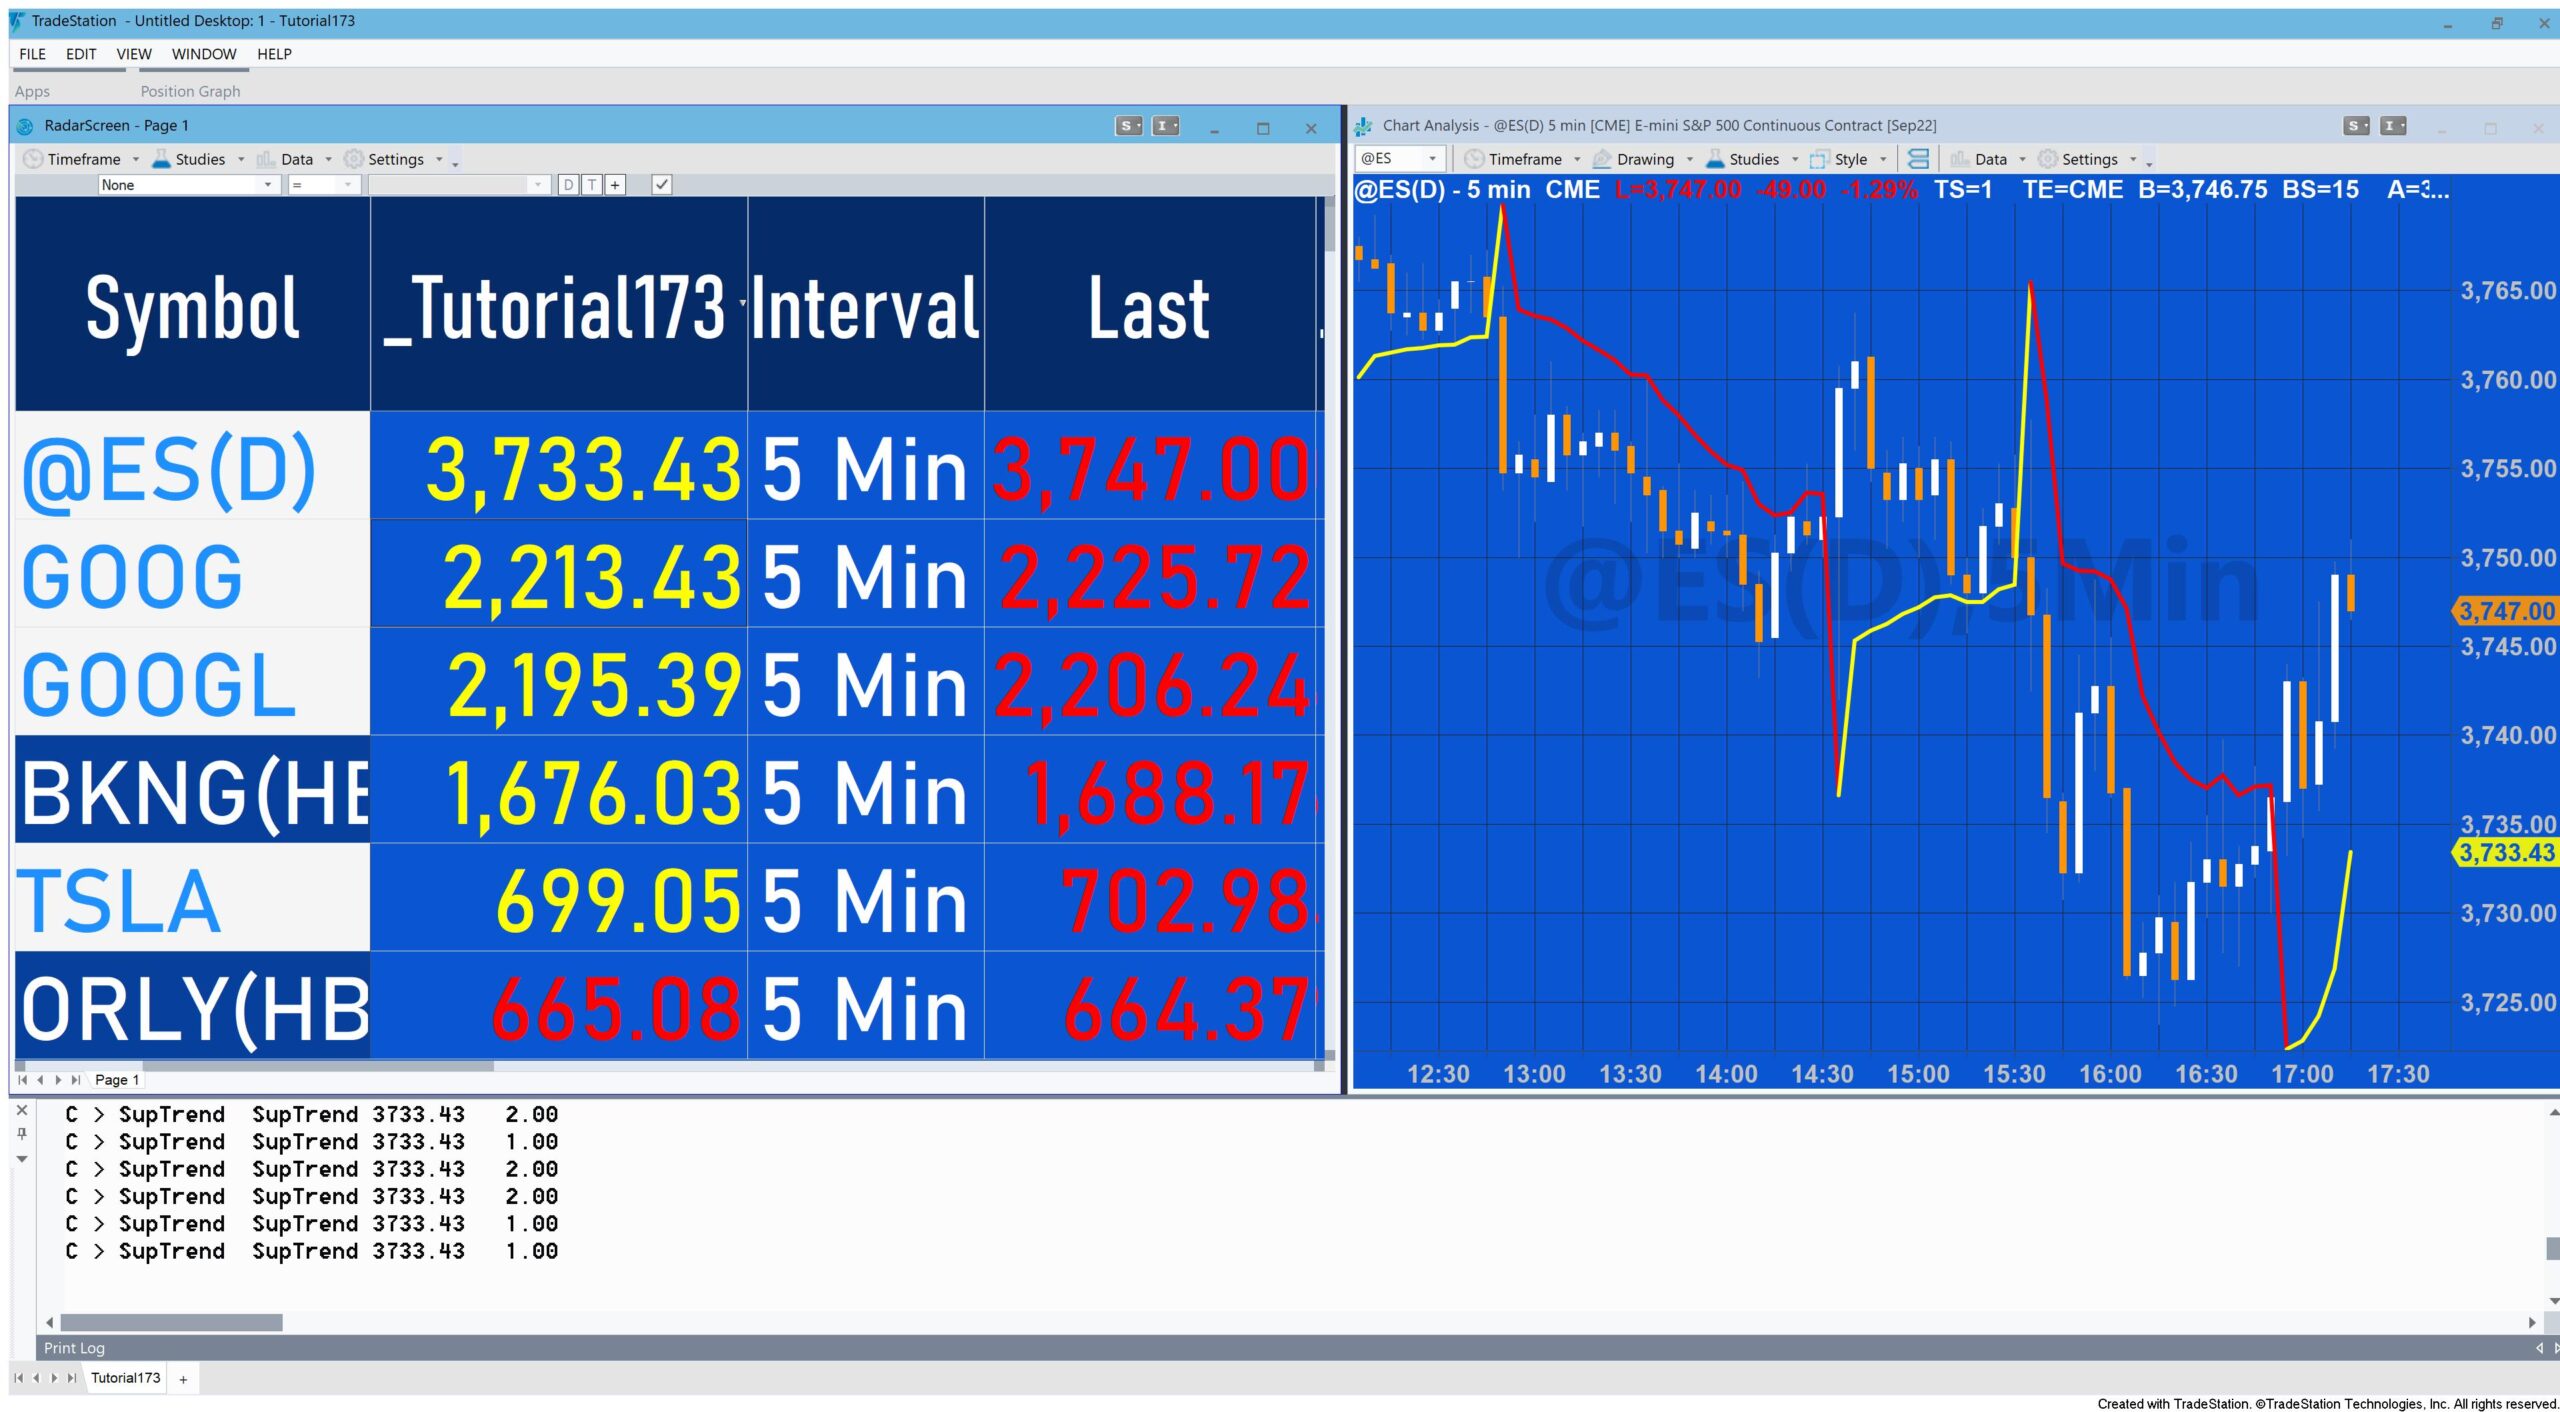
Using tutorial 173 with RadarScreen
The above video demonstrates how to set up Tutorial 173 (Markplex SuperTrend) in TradeStation RadarScreen. This involves making sure that “load additional data for accumulative calculations” is selected and an appropriate number of bars is entered.
“Load additional data” is required for calculations that use the value of the calculation the previous bar to give the value for the current bar. Tutorial 173 uses the exponential moving average as part of its calculation. If you open TradeStation’s XAverage function, you will see the calculation includes:
XAverage = XAverage[1] + SmoothingFactor * ( Price - XAverage[1] );
In other words, the exponential moving average for the current bar is equal to the exponential moving average for the previous bar plus the difference between the price of the current bar and the exponential moving average of the previous bar multiplied by a smoothing factor.
TradeStation recommend that the number of additional bars is equal to 4.5 multiplied by the Length input. In this video I estimated this to be 50.
See https://markplex.com/free-tutorials/tradestation-easylanguage-quicktips/quick-tip-5-indicator-works-fine-chart-not-radarscreen/
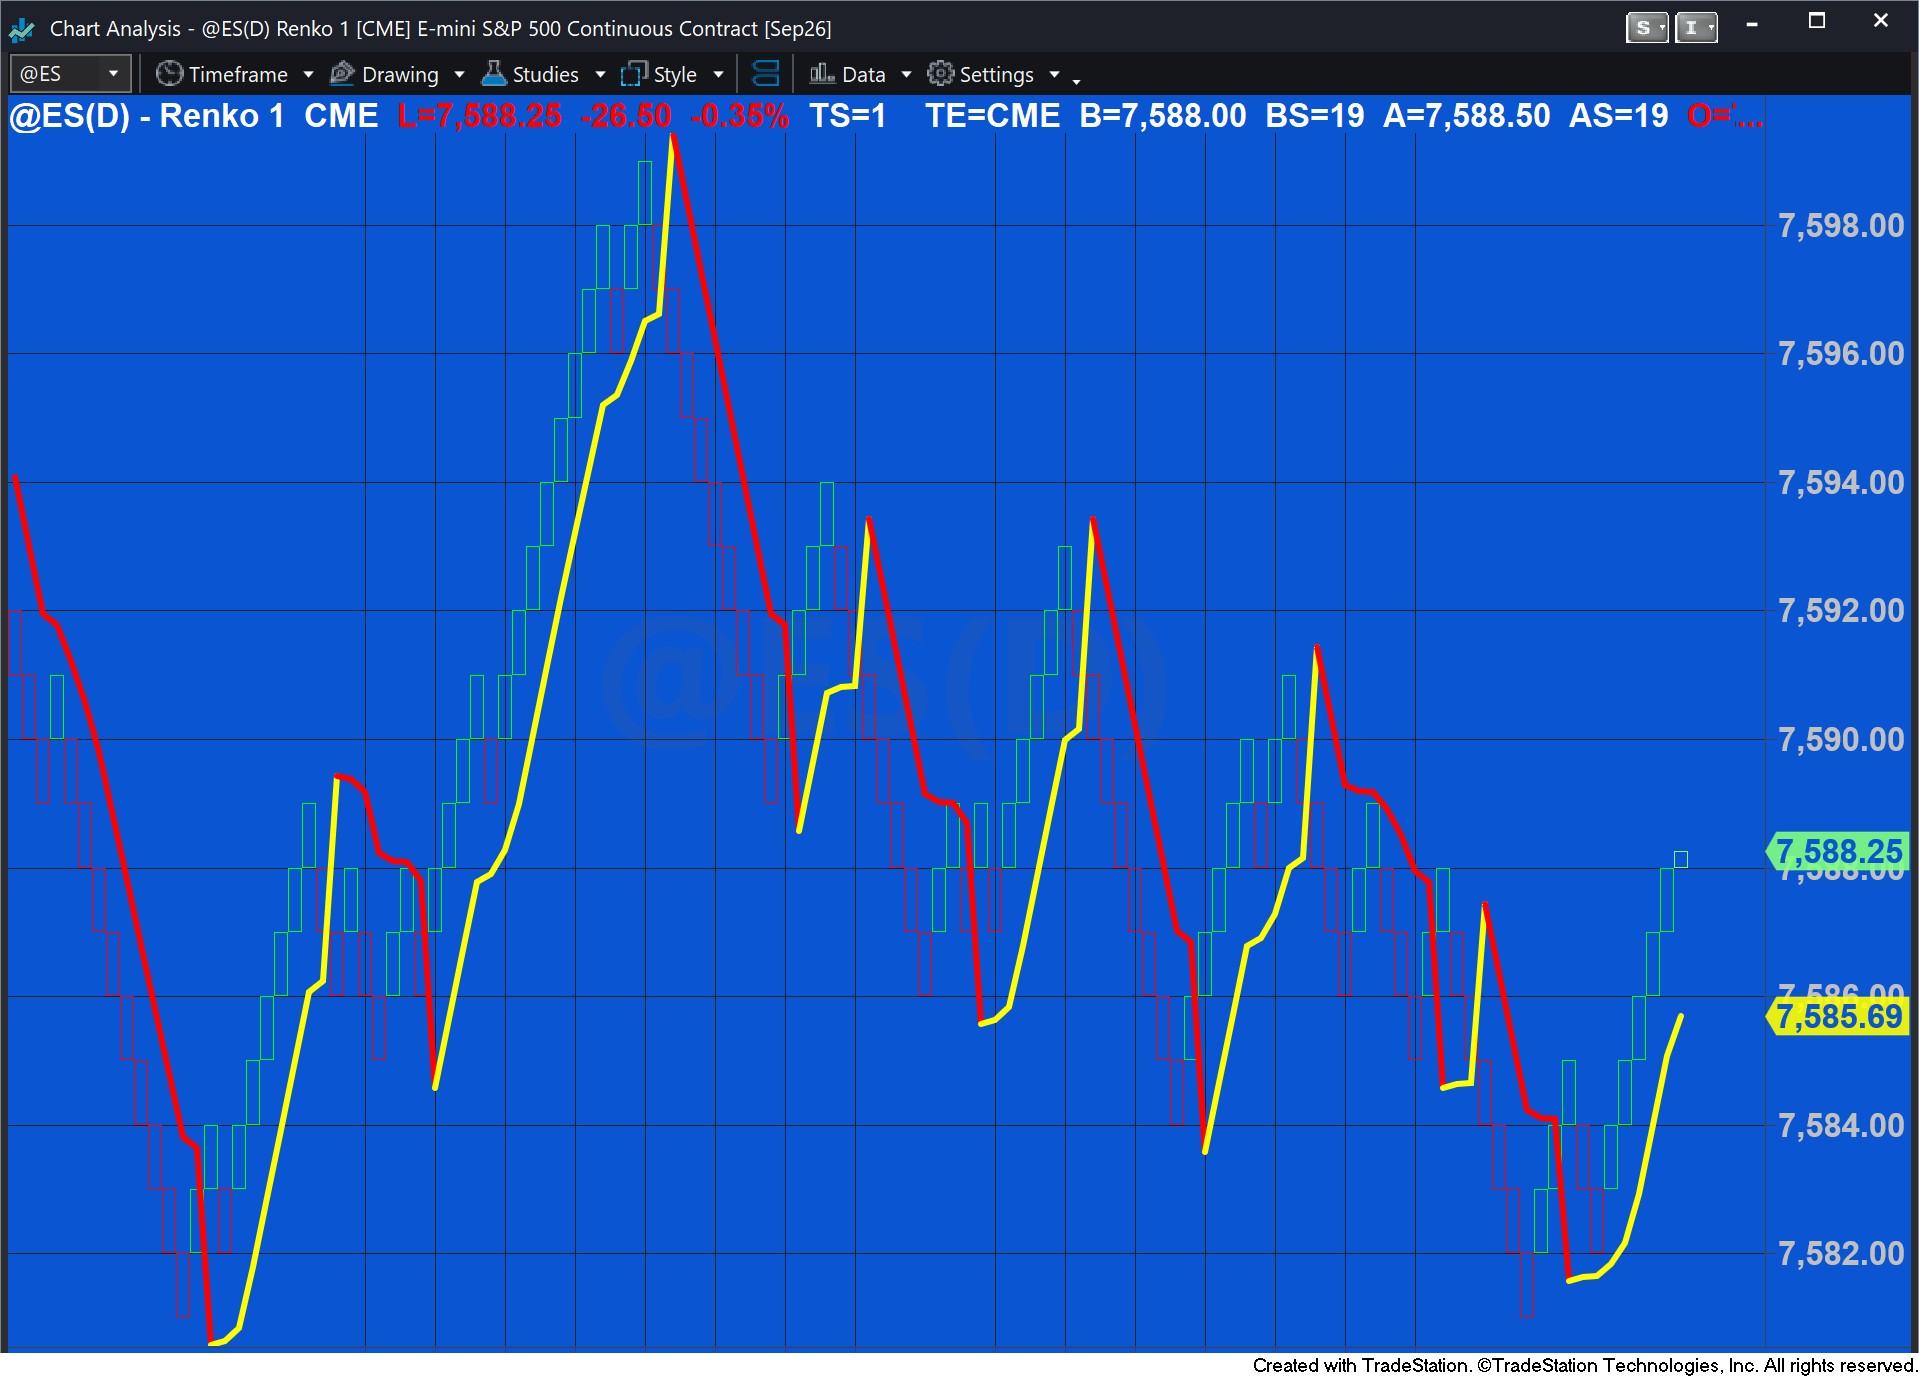
Renko Charts
Using SuperTrend on Renko Charts
Why a modified version is needed
The original SuperTrend indicator calculates its trailing bands using the Average True Range (ATR) of price. This works well on time-based charts, where the true range of each bar reflects genuine market volatility.
Renko charts work differently. Every brick represents a fixed price move — the box size — regardless of how long it took to form. Because of this, the true range of most Renko bricks converges toward a near-constant value tied directly to the box size itself. Feeding that into an ATR calculation produces a band offset that looks like it’s responding to volatility, but is really just echoing the box size back with extra steps. The result is bands that carry a false sense of precision without adding real information.
What this version does differently
Instead of calculating ATR, this version derives the band offset directly from the Renko box size:
Band Offset = Multiplier × BoxSize
The box size itself can be read automatically using EasyLanguage’s BoxSize reserved word. This means the offset always matches whatever box size is set on the chart, without needing a manually maintained input that could fall out of sync if the brick size is changed.
Everything else about the SuperTrend mechanic stays intact:
- Direction flips based on Close relative to the trailing line, exactly as in the original.
- The trailing line only moves in the direction of the trend — it tightens toward price but never loosens against it, preserving the stop-and-reverse behavior the indicator is known for.
- An acceleration factor still increases incrementally each bar the trend continues, gradually pulling the line closer to price, up to a user-defined maximum.
What to expect on a Renko chart
Because Renko bricks only form on confirmed price movement, this version tends to behave a little differently than its time-based counterpart:
- Fewer small whipsaws — sub-box-size noise never reaches the chart in the first place, so the indicator doesn’t have as much minor chop to react to.
- Sharper reversals — since every brick already represents a confirmed move of at least one box size, a flip in direction tends to be more decisive rather than gradual.
- Different tuning than a time-based chart — since each bar here represents a real price move rather than a fixed unit of time, the Multiplier, AFStep, and MaxAF inputs often need retuning rather than reusing the same values from a time-based setup.
Bottom line
If you trade Renko charts and want a SuperTrend-style trailing stop that reflects your actual box size rather than a distorted ATR calculation, this version gives you that — using the same core direction and trailing logic that made the original useful, adapted to work properly with the way Renko charts are actually built.
Download the tutorial 173 Renko version TradeStation EasyLanguage indicator
See tutorial 43 which demonstrates how to import an ELD into TradeStation.
THE TRADING APPS, INDICATORS, SHOW ME STUDIES, STRATEGIES AND OTHER PROGRAMS HAVE BEEN INCLUDED SOLELY FOR EDUCATIONAL PURPOSES.
TO THE BEST OF MARKPLEX CORPORATION’S KNOWLEDGE, ALL OF THE INFORMATION ON THIS PAGE IS CORRECT, AND IT IS PROVIDED IN THE HOPE THAT IT WILL BE USEFUL. HOWEVER, MARKPLEX CORPORATION ASSUMES NO LIABILITY FOR ANY DAMAGES, DIRECT OR OTHERWISE, RESULTING FROM THE USE OF THIS INFORMATION AND/OR PROGRAM(S) DESCRIBED, AND NO WARRANTY IS MADE REGARDING ITS ACCURACY OR COMPLETENESS. USE OF THIS INFORMATION AND/OR PROGRAMS DESCRIBED IS AT YOUR OWN RISK.
ANY EASYLANGUAGE OR POWERLANGUAGE TRADING STRATEGIES, TRADING APPS, SIGNALS, STUDIES, INDICATORS, SHOWME STUDIES, PAINTBAR STUDIES, PROBABILITYMAP STUDIES, ACTIVITYBAR STUDIES, FUNCTIONS (AND PARTS THEREOF) AND ASSOCIATED TECHNIQUES REFERRED TO, INCLUDED IN OR ATTACHED TO THIS TUTORIAL OR PROGRAM DESCRIPTION ARE EXAMPLES ONLY, AND HAVE BEEN INCLUDED SOLELY FOR EDUCATIONAL PURPOSES. MARKPLEX CORPORATION. DOES NOT RECOMMEND THAT YOU USE ANY SUCH TRADING STRATEGIES, SIGNALS, STUDIES, INDICATORS, SHOWME STUDIES, PAINTBAR STUDIES, PROBABILITYMAP STUDIES, ACTIVITYBAR STUDIES, FUNCTIONS (OR ANY PARTS THEREOF) OR TECHNIQUES. THE USE OF ANY SUCH TRADING STRATEGIES, SIGNALS, STUDIES, INDICATORS, SHOWME STUDIES, PAINTBAR STUDIES, PROBABILITYMAP STUDIES, ACTIVITYBAR STUDIES, FUNCTIONS AND TECHNIQUES DOES NOT GUARANTEE THAT YOU WILL MAKE PROFITS, INCREASE PROFITS, OR MINIMIZE LOSSES.