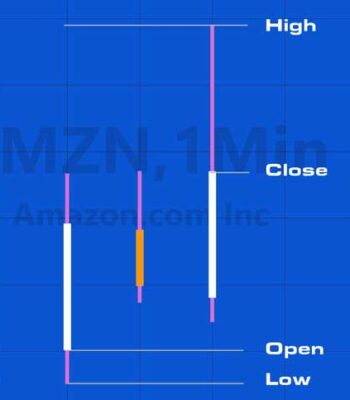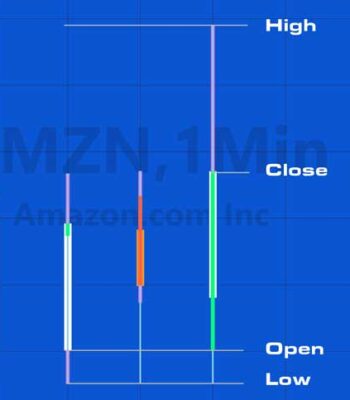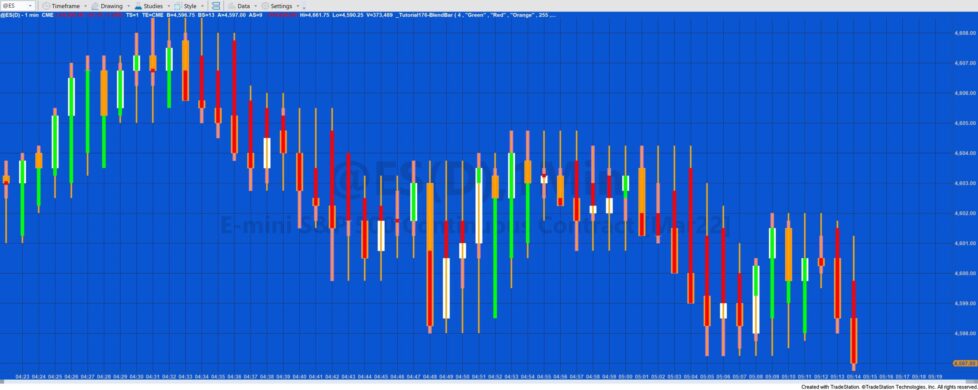
_Tutorial176-BlendBar ‘merges’ the open, high and low for a user input number of bars to create a ‘blended bar’. For example, if the user input BlendNum were set to 3 the the high of the ‘blend bar’ would be the highest high of the current bar and the two before it. The low would be the lowest low of the current bar and the two before it, the open would be the open 3 bars ago and the close, the close of the current bar.
In EasyLanguage these values can be found as follows:
Highest high of BlendNum bars: Highest( H, BlendNum )
Lowest low of BlendNum bars: Lowest( L, BlendNum )
Open of BlendNum bars: O[BlendNum – 1] or Open[BlendNum – 1]
Close: C or Close
where BlendNum is a user input
This tutorial demonstrates two ways that the blend bars can be included on the chart:
- Drawing the bars. With the second option the bars are drawn using the trendline objects. The tutorial program does not work with MultiCharts
- Using a paintbar
Drawing the ‘blend bars’
The trendline representing the wick is drawn with a lower weight setting than the trendline representing the body. To color of the bodies is changed depending on whether open is above or below close.
Since the trendlines are drawn every tick, the persist property is used to ensure that the trendlines only stay on the chart on the last tick of the bar when persist is set to true.
Because having two many drawing objects on a chart can degrade performance, the program deletes the earliest trendlines after more than a user input number of trendlines have been drawn.
The blendbar color is determined by the user input strings: UpCol, DnCol and WickCol. These values must be ‘named colors’ (see list on the tutorial page) otherwise TradeStation will replace the color with black. The user inputs are converted into color objects and their transparency set using using input: Alpha.
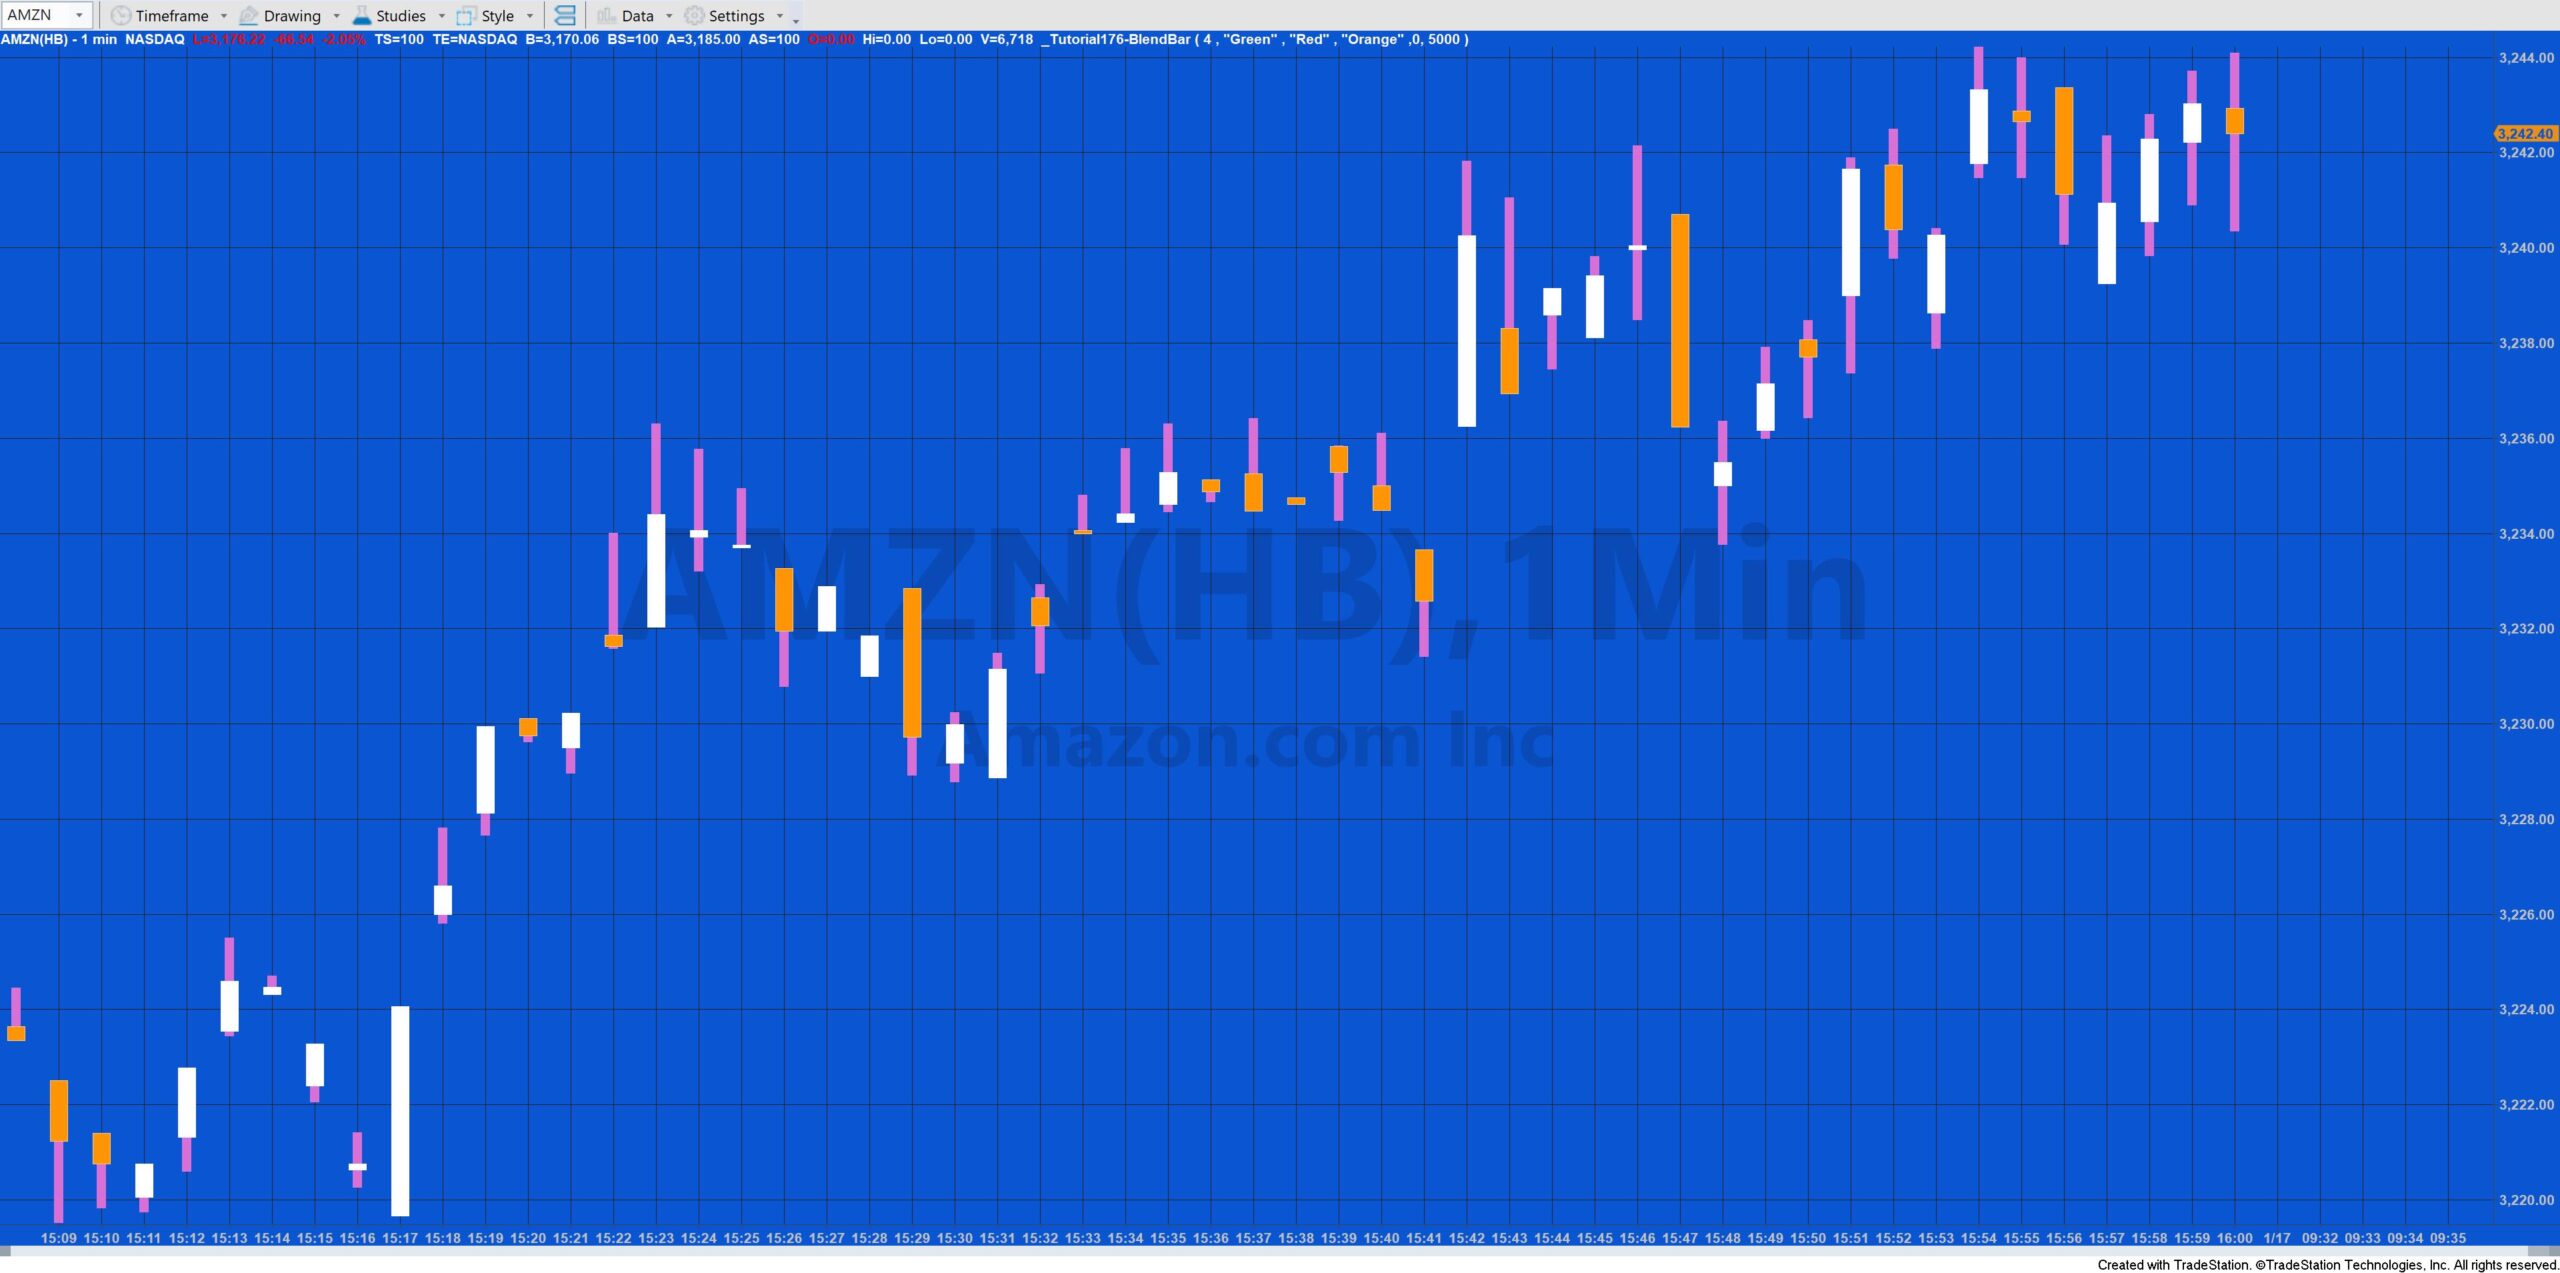
- In the images above the BlendNum user input is set to 3. The left image includes normal candlestick bars (with a magenta wick and white or orange bodies. White for up-bars and orange for down-bars).
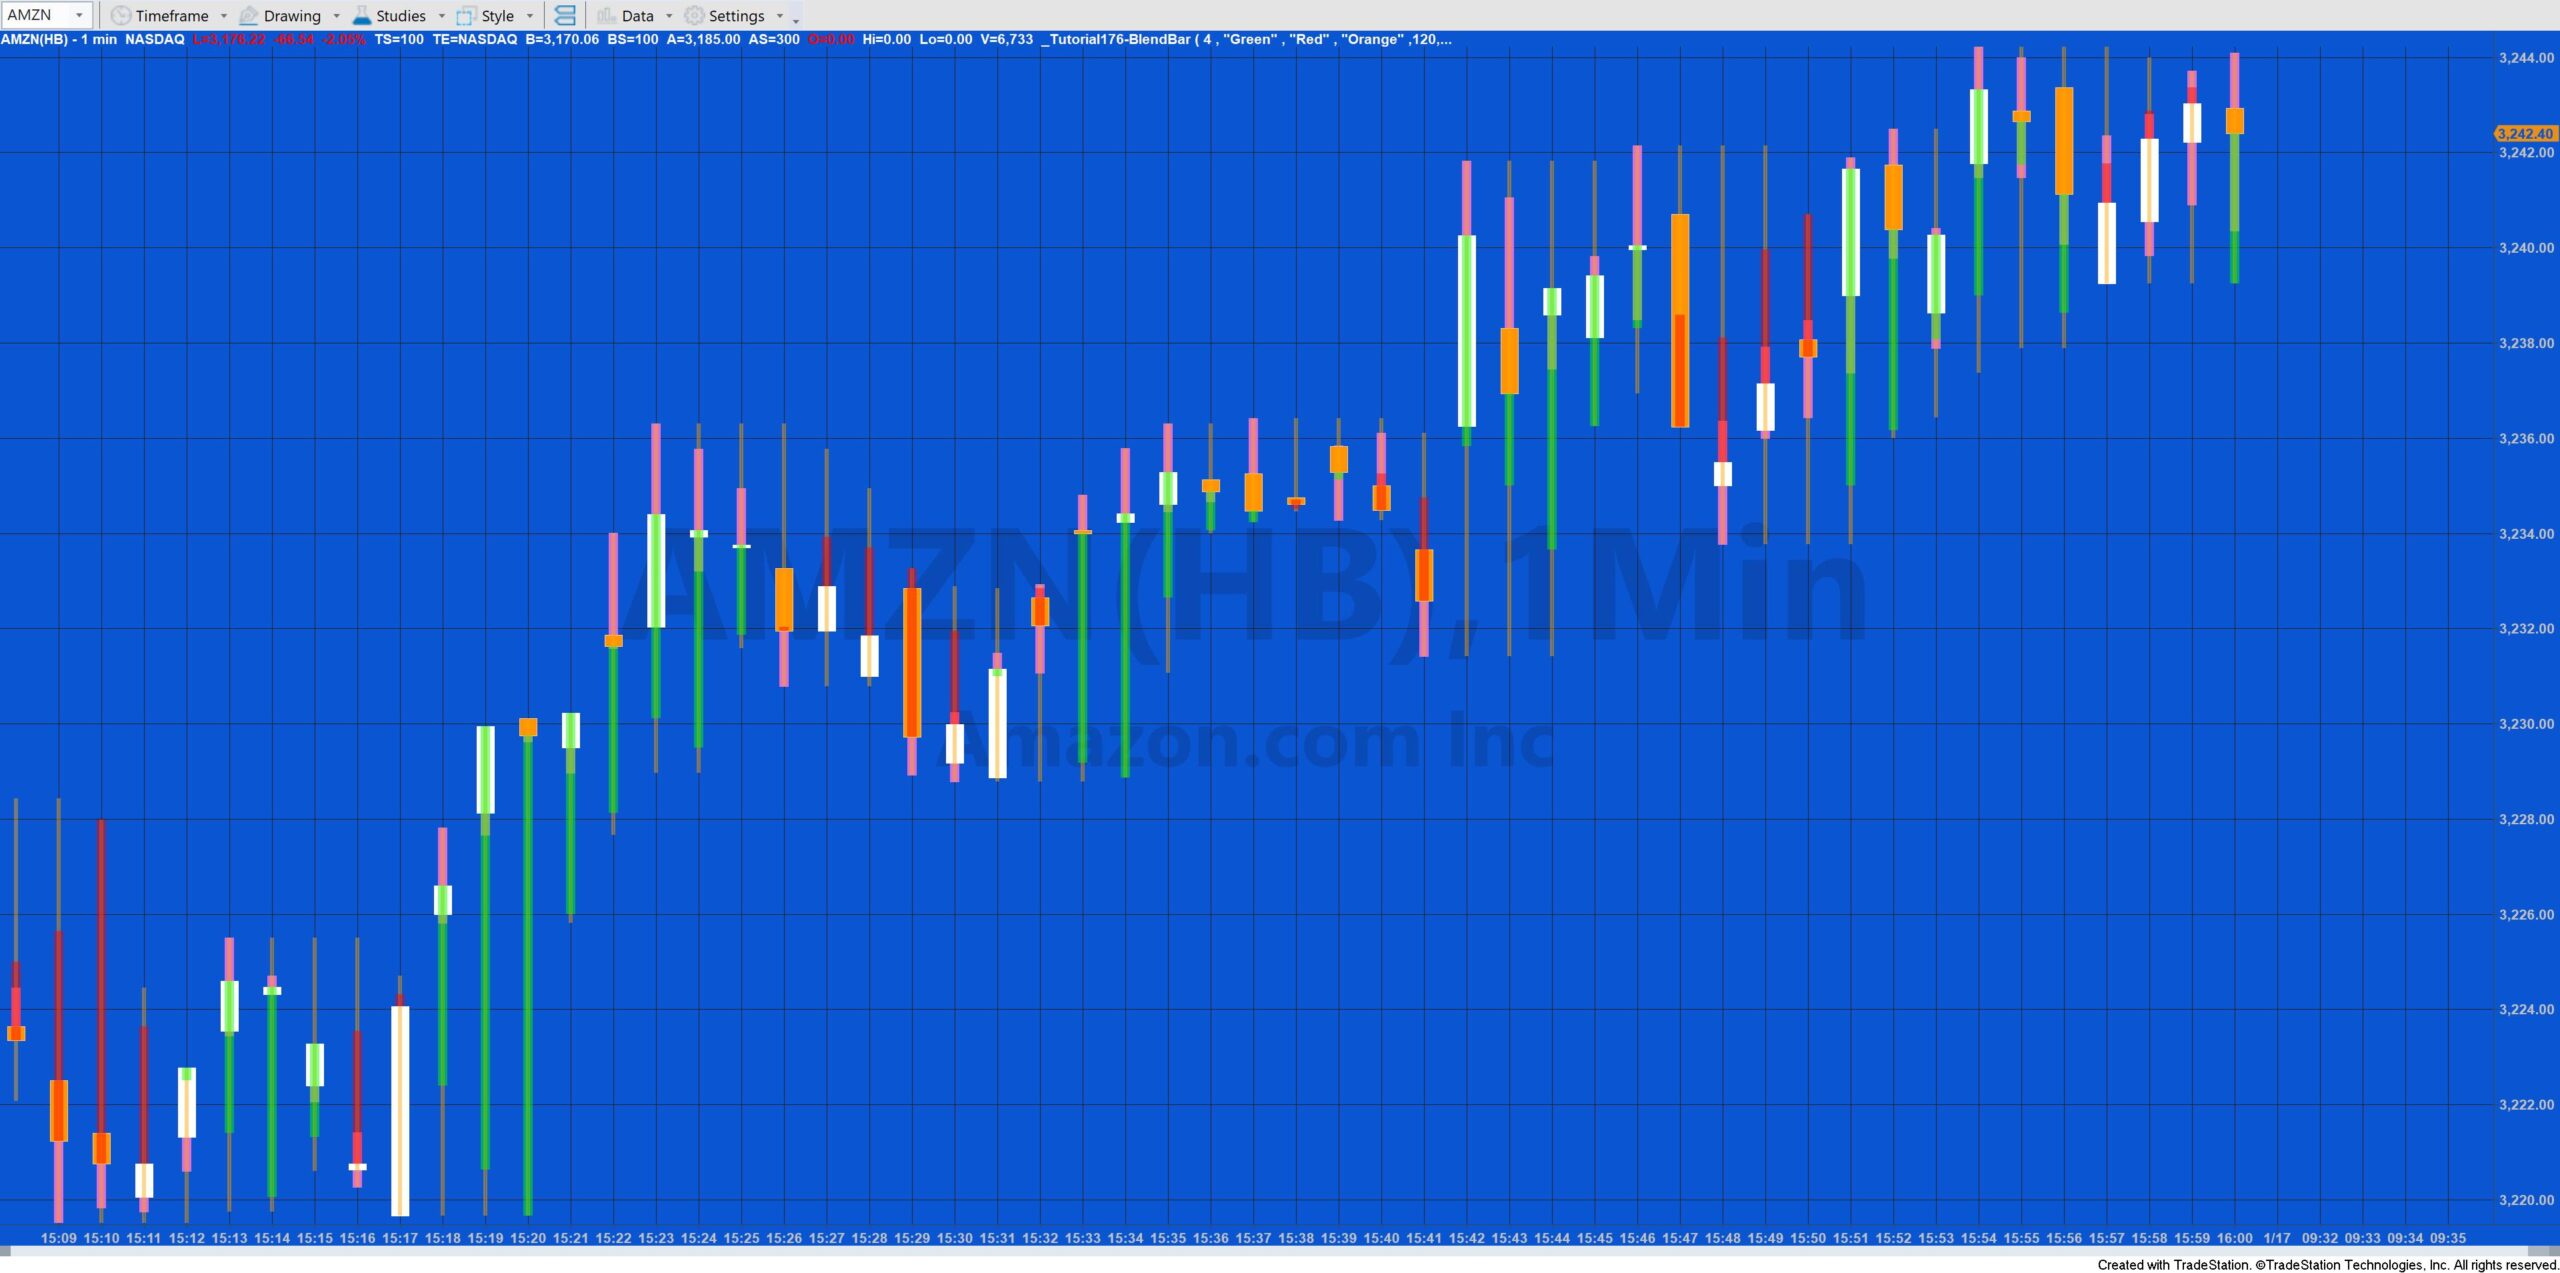
- The image on the right shows the same bars but with the 'blend bar' applied. The 'blend bars' have a pale blue wick and green or red bodies. Green for up bars, otherwise red (the colors are set by user inputs.) Looking at the bar on the right, you will see how the attributes of the original three bars are applied to the blend bar. N.B. The text and lines were added in a drawing program.
Technical lessons
This tutorial illustrates various programming techniques, including:
- Using trendline drawing objects
- Using a text string text string to create a color object
- Changing the transparency of a color object
- Managing the number of drawing objects on the chart
Using a PaintBar study
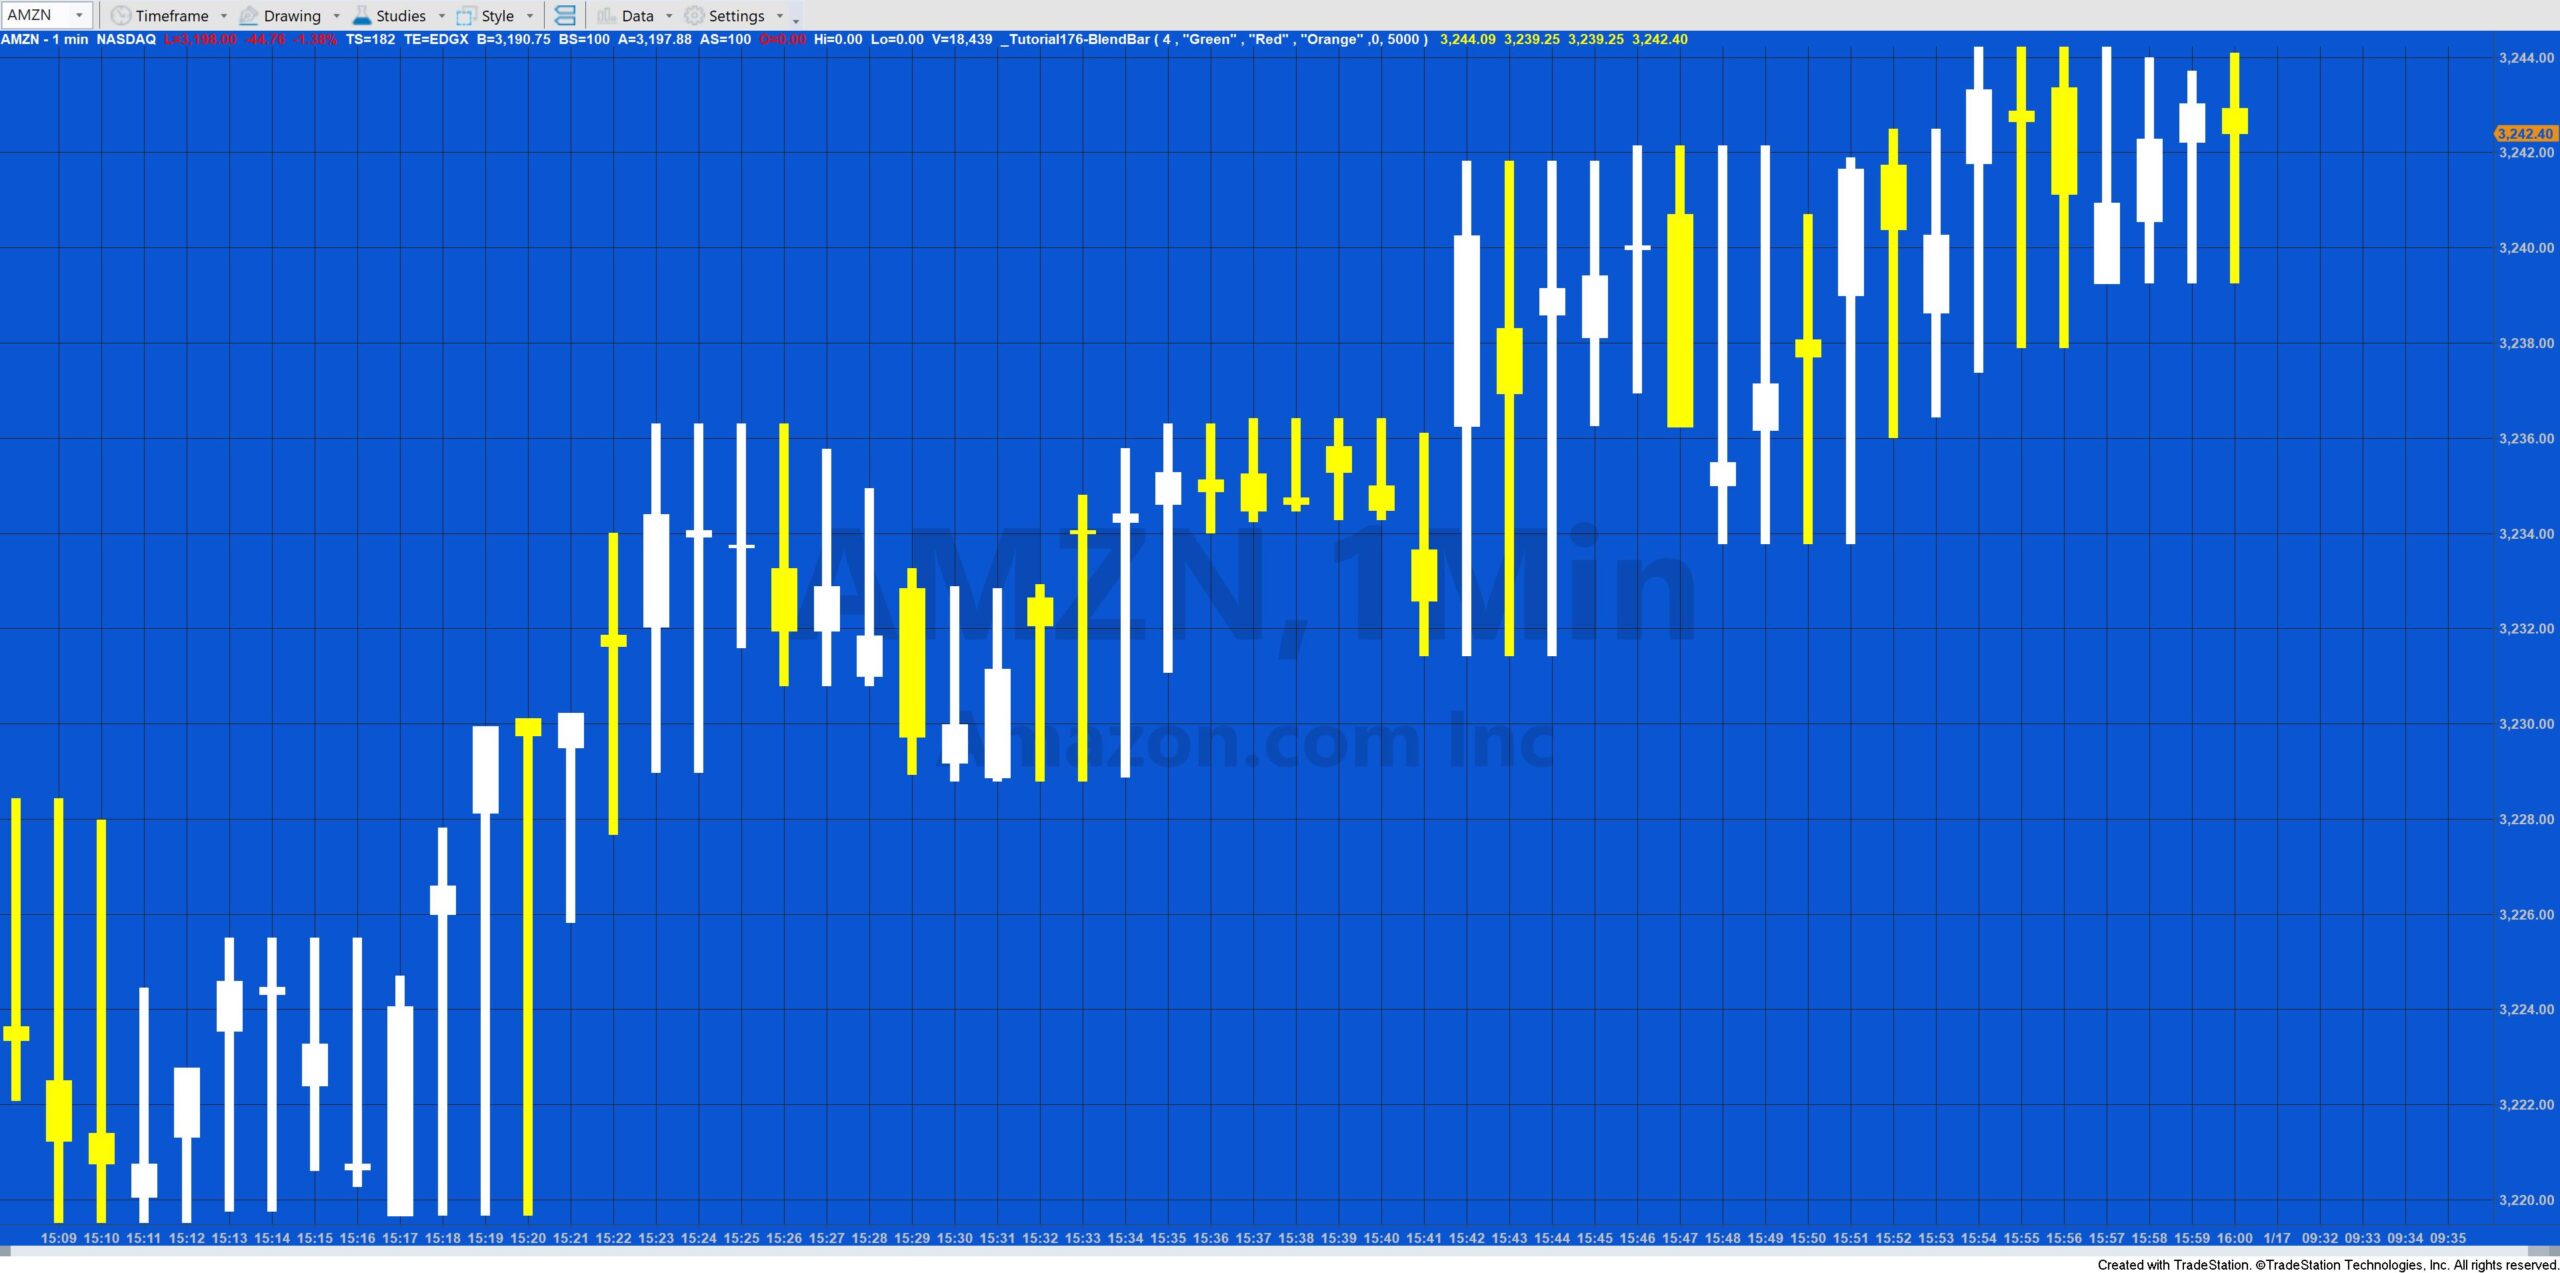
It is also possible to plot the blend bars using a paint bar study using the following code:
If C > O then PlotPaintBar( Highest( H, BlendNum ), Lowest( L, BlendNum ), O[ BlendNum - 1 ], C, "BlendBar", White, Default, 2  )
else PlotPaintBar( Highest( H, BlendNum ), Lowest( L, BlendNum ), O[ BlendNum - 1 ], C, "BlendBar", Yellow, Default, 2 );
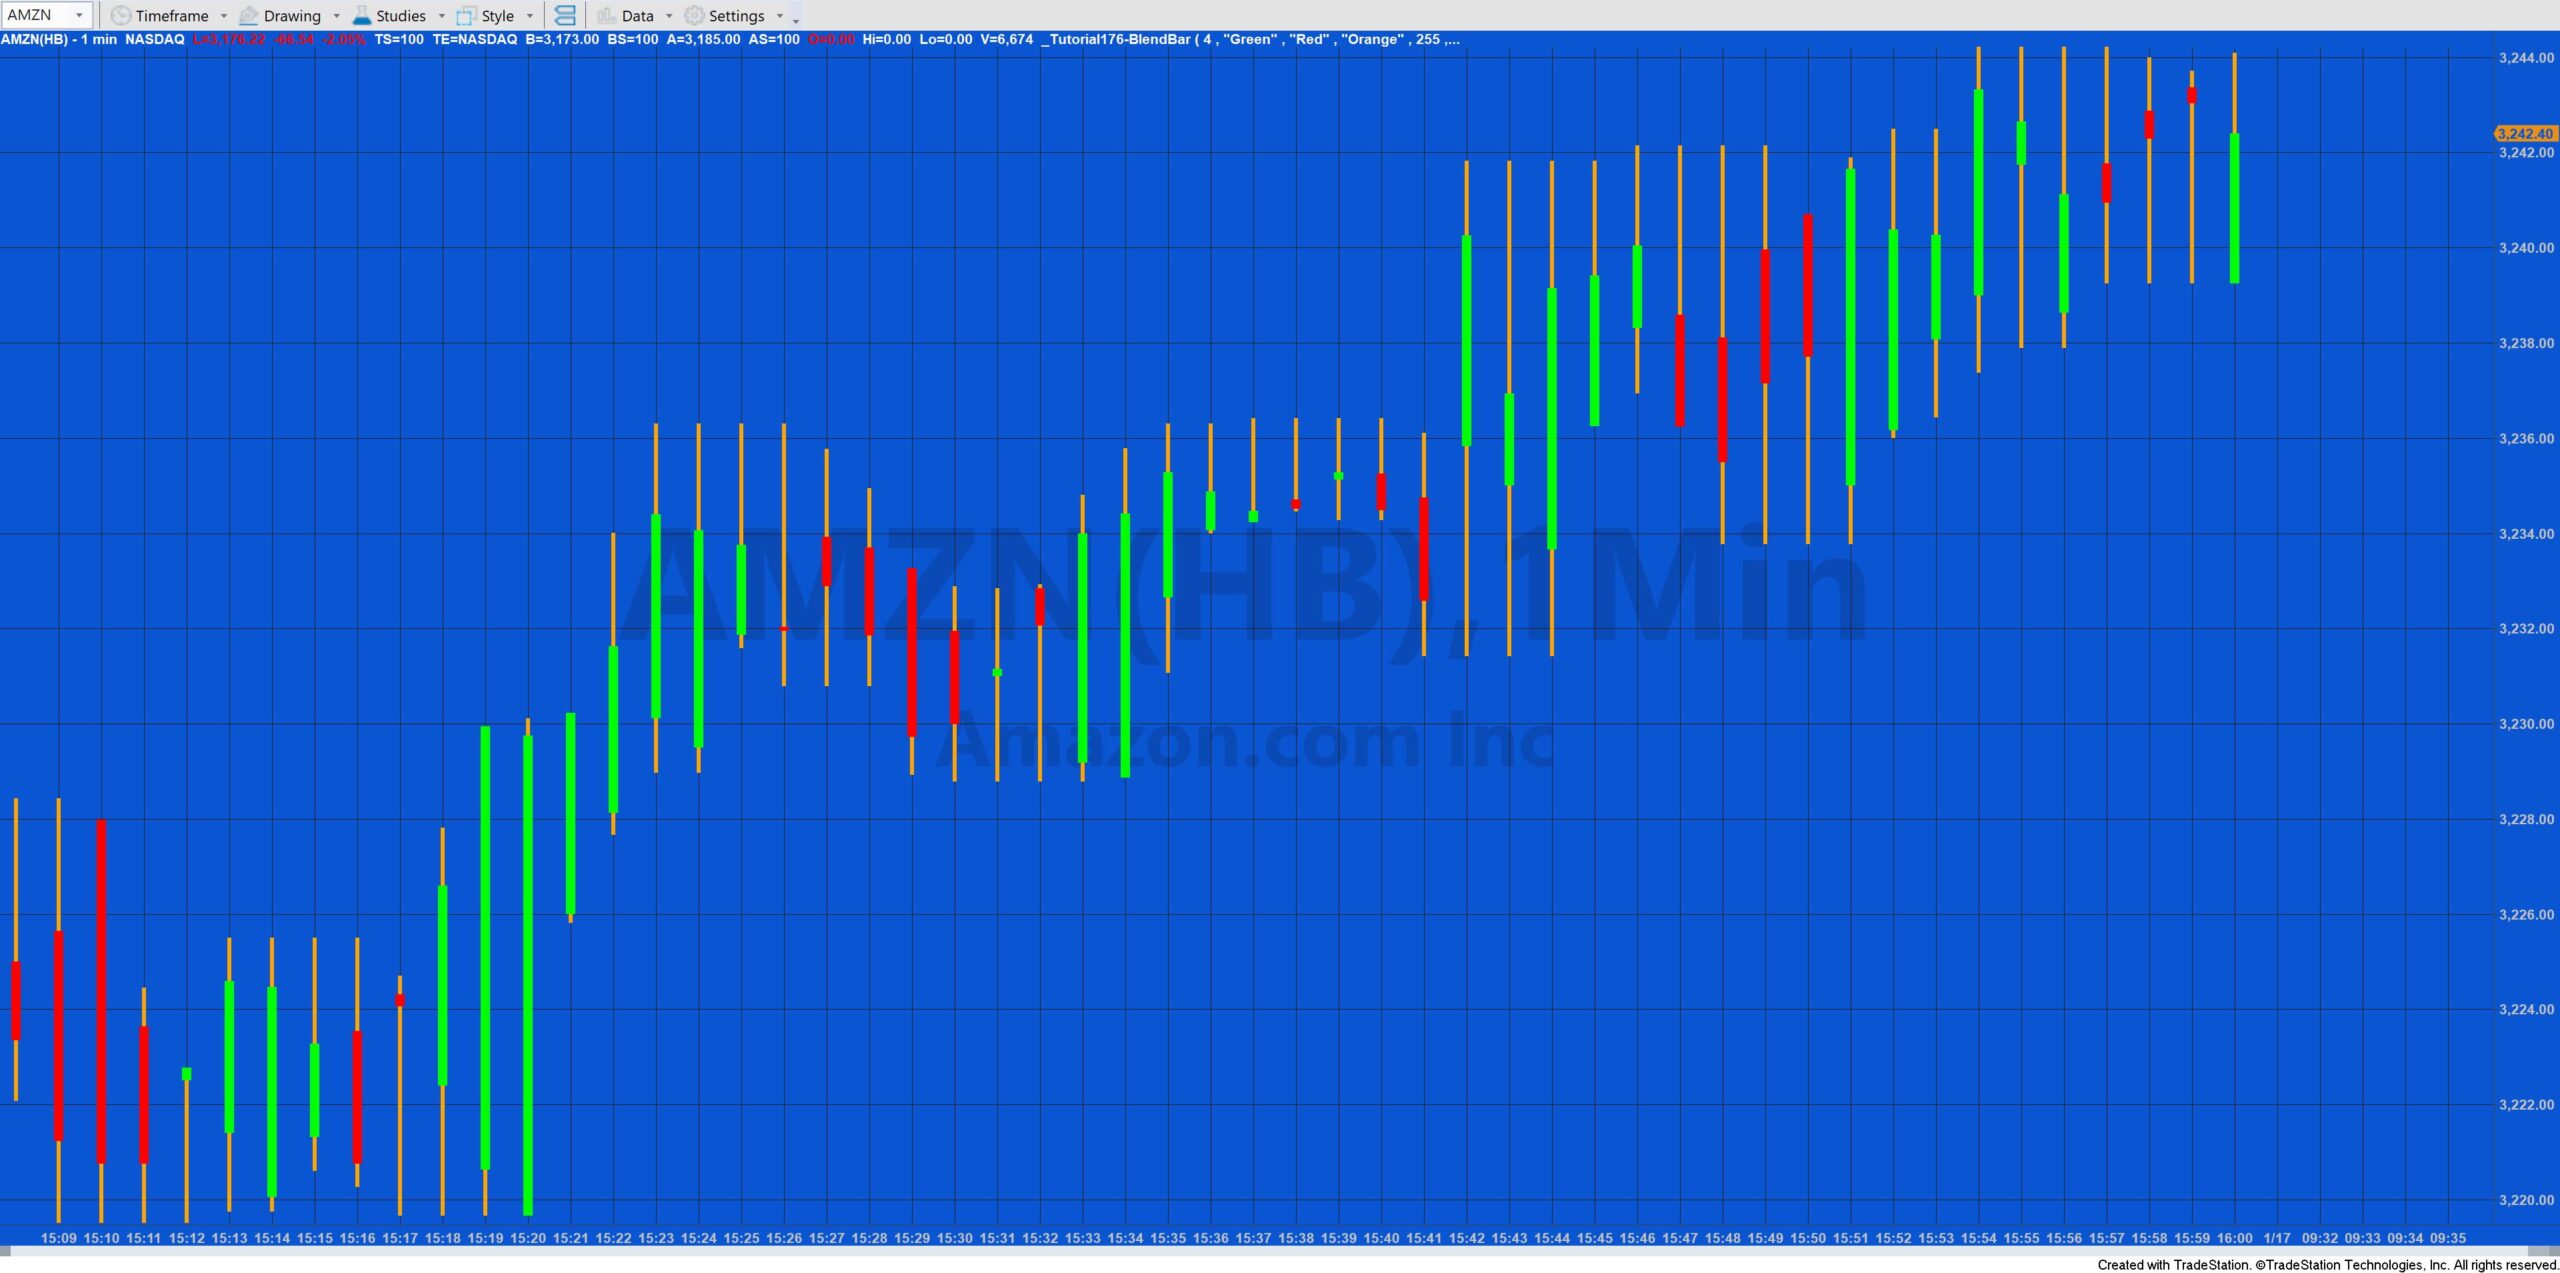
This yields paint bars like:
Download the tutorial 176 TradeStation EasyLanguage indicator
If you want to save yourself some typing, the tutorial 176 code is available for immediate download for $19.95 by clicking the following button. You can pay using PayPal or credit card. The program works with TradeStation 9.5 and 10.
The download consists of _Tutorial176 (the TradeStation EasyLanguage Paintbar Study developed in the tutorial).
See tutorial 43 which demonstrates how to import an ELD into TradeStation.
Colors
| AliceBlue | DarkSlateGray | LightSalmon | PaleVioletRed |
| AntiqueWhite | DarkTurquoise | LightSeaGreen | PapayaWhip |
| Aqua | DarkViolet | LightSkyBlue | PeachPuff |
| Aquamarine | DeepPink | LightSlateGray | Peru |
| Azure | DeepSkyBlue | LightSteelBlue | Pink |
| Beige | DimGray | LightYellow | Plum |
| Bisque | DodgerBlue | Lime | PowderBlue |
| Black | Firebrick | LimeGreen | Purple |
| BlanchedAlmond | FloralWhite | Linen | Red |
| Blue | ForestGreen | Magenta | RosyBrown |
| BlueViolet | Fuschia | Maroon | RoyalBlue |
| Brown | Gainsboro | MediumAquamarine | SaddleBrown |
| Burlywood | GhostWhite | MediumBlue | Salmon |
| CadetBlue | Gold | MediumOrchid | SandyBrown |
| Chartreuse | Goldenrod | MediumPurple | SeaGreen |
| Chocolate | Gray | MediumSeaGreen | Seashell |
| Coral | Green | MediumSlateBlue | Sienna |
| CornflowerBlue | GreenYellow | MediumSpringGreen | Silver |
| Cornsilk | Honeydew | MediumTurquoise | SkyBlue |
| Cyan | HotPink | MediumVioletRed | SlateBlue |
| DarkBlue | IndianRed | MidnightBlue | SlateGray |
| DarkBrown | Indigo | MintCream | Snow |
| DarkCyan | Ivory | MistyRose | SpringGreen |
| DarkGoldenrod | Khaki | Moccasin | SteelBlue |
| DarkGray | Lavender | NavajoWhite | Tan |
| DarkGreen | LavenderBlush | Navy | Teal |
| DarkKhaki | LawnGreen | OldLace | Thistle |
| Dark Magenta | LemonChiffon | Olive | Tomato |
| DarkOliveGreen | LightBlue | OliveDrab | Turquoise |
| DarkOrange | LightCoral | Orange | Violet |
| DarkOrchid | LightCyan | OrangeRed | Wheat |
| DarkRed | LightGoldenrodYellow | Orchid | White |
| DarkSalmon | LightGray | PaleGoldenrod | WhiteSmoke |
| DarkSeaGreen | LightGreen | PaleGreen | Yellow |
| DarkSlateBlue | LightPink | PaleTurquoise | YellowGreen |
THE TRADING APPS, INDICATORS, SHOW ME STUDIES, STRATEGIES AND OTHER PROGRAMS HAVE BEEN INCLUDED SOLELY FOR EDUCATIONAL PURPOSES.
TO THE BEST OF MARKPLEX CORPORATION’S KNOWLEDGE, ALL OF THE INFORMATION ON THIS PAGE IS CORRECT, AND IT IS PROVIDED IN THE HOPE THAT IT WILL BE USEFUL. HOWEVER, MARKPLEX CORPORATION ASSUMES NO LIABILITY FOR ANY DAMAGES, DIRECT OR OTHERWISE, RESULTING FROM THE USE OF THIS INFORMATION AND/OR PROGRAM(S) DESCRIBED, AND NO WARRANTY IS MADE REGARDING ITS ACCURACY OR COMPLETENESS. USE OF THIS INFORMATION AND/OR PROGRAMS DESCRIBED IS AT YOUR OWN RISK.
ANY EASYLANGUAGE OR POWERLANGUAGE TRADING STRATEGIES, TRADING APPS, SIGNALS, STUDIES, INDICATORS, SHOWME STUDIES, PAINTBAR STUDIES, PROBABILITYMAP STUDIES, ACTIVITYBAR STUDIES, FUNCTIONS (AND PARTS THEREOF) AND ASSOCIATED TECHNIQUES REFERRED TO, INCLUDED IN OR ATTACHED TO THIS TUTORIAL OR PROGRAM DESCRIPTION ARE EXAMPLES ONLY, AND HAVE BEEN INCLUDED SOLELY FOR EDUCATIONAL PURPOSES. MARKPLEX CORPORATION. DOES NOT RECOMMEND THAT YOU USE ANY SUCH TRADING STRATEGIES, SIGNALS, STUDIES, INDICATORS, SHOWME STUDIES, PAINTBAR STUDIES, PROBABILITYMAP STUDIES, ACTIVITYBAR STUDIES, FUNCTIONS (OR ANY PARTS THEREOF) OR TECHNIQUES. THE USE OF ANY SUCH TRADING STRATEGIES, SIGNALS, STUDIES, INDICATORS, SHOWME STUDIES, PAINTBAR STUDIES, PROBABILITYMAP STUDIES, ACTIVITYBAR STUDIES, FUNCTIONS AND TECHNIQUES DOES NOT GUARANTEE THAT YOU WILL MAKE PROFITS, INCREASE PROFITS, OR MINIMIZE LOSSES.

