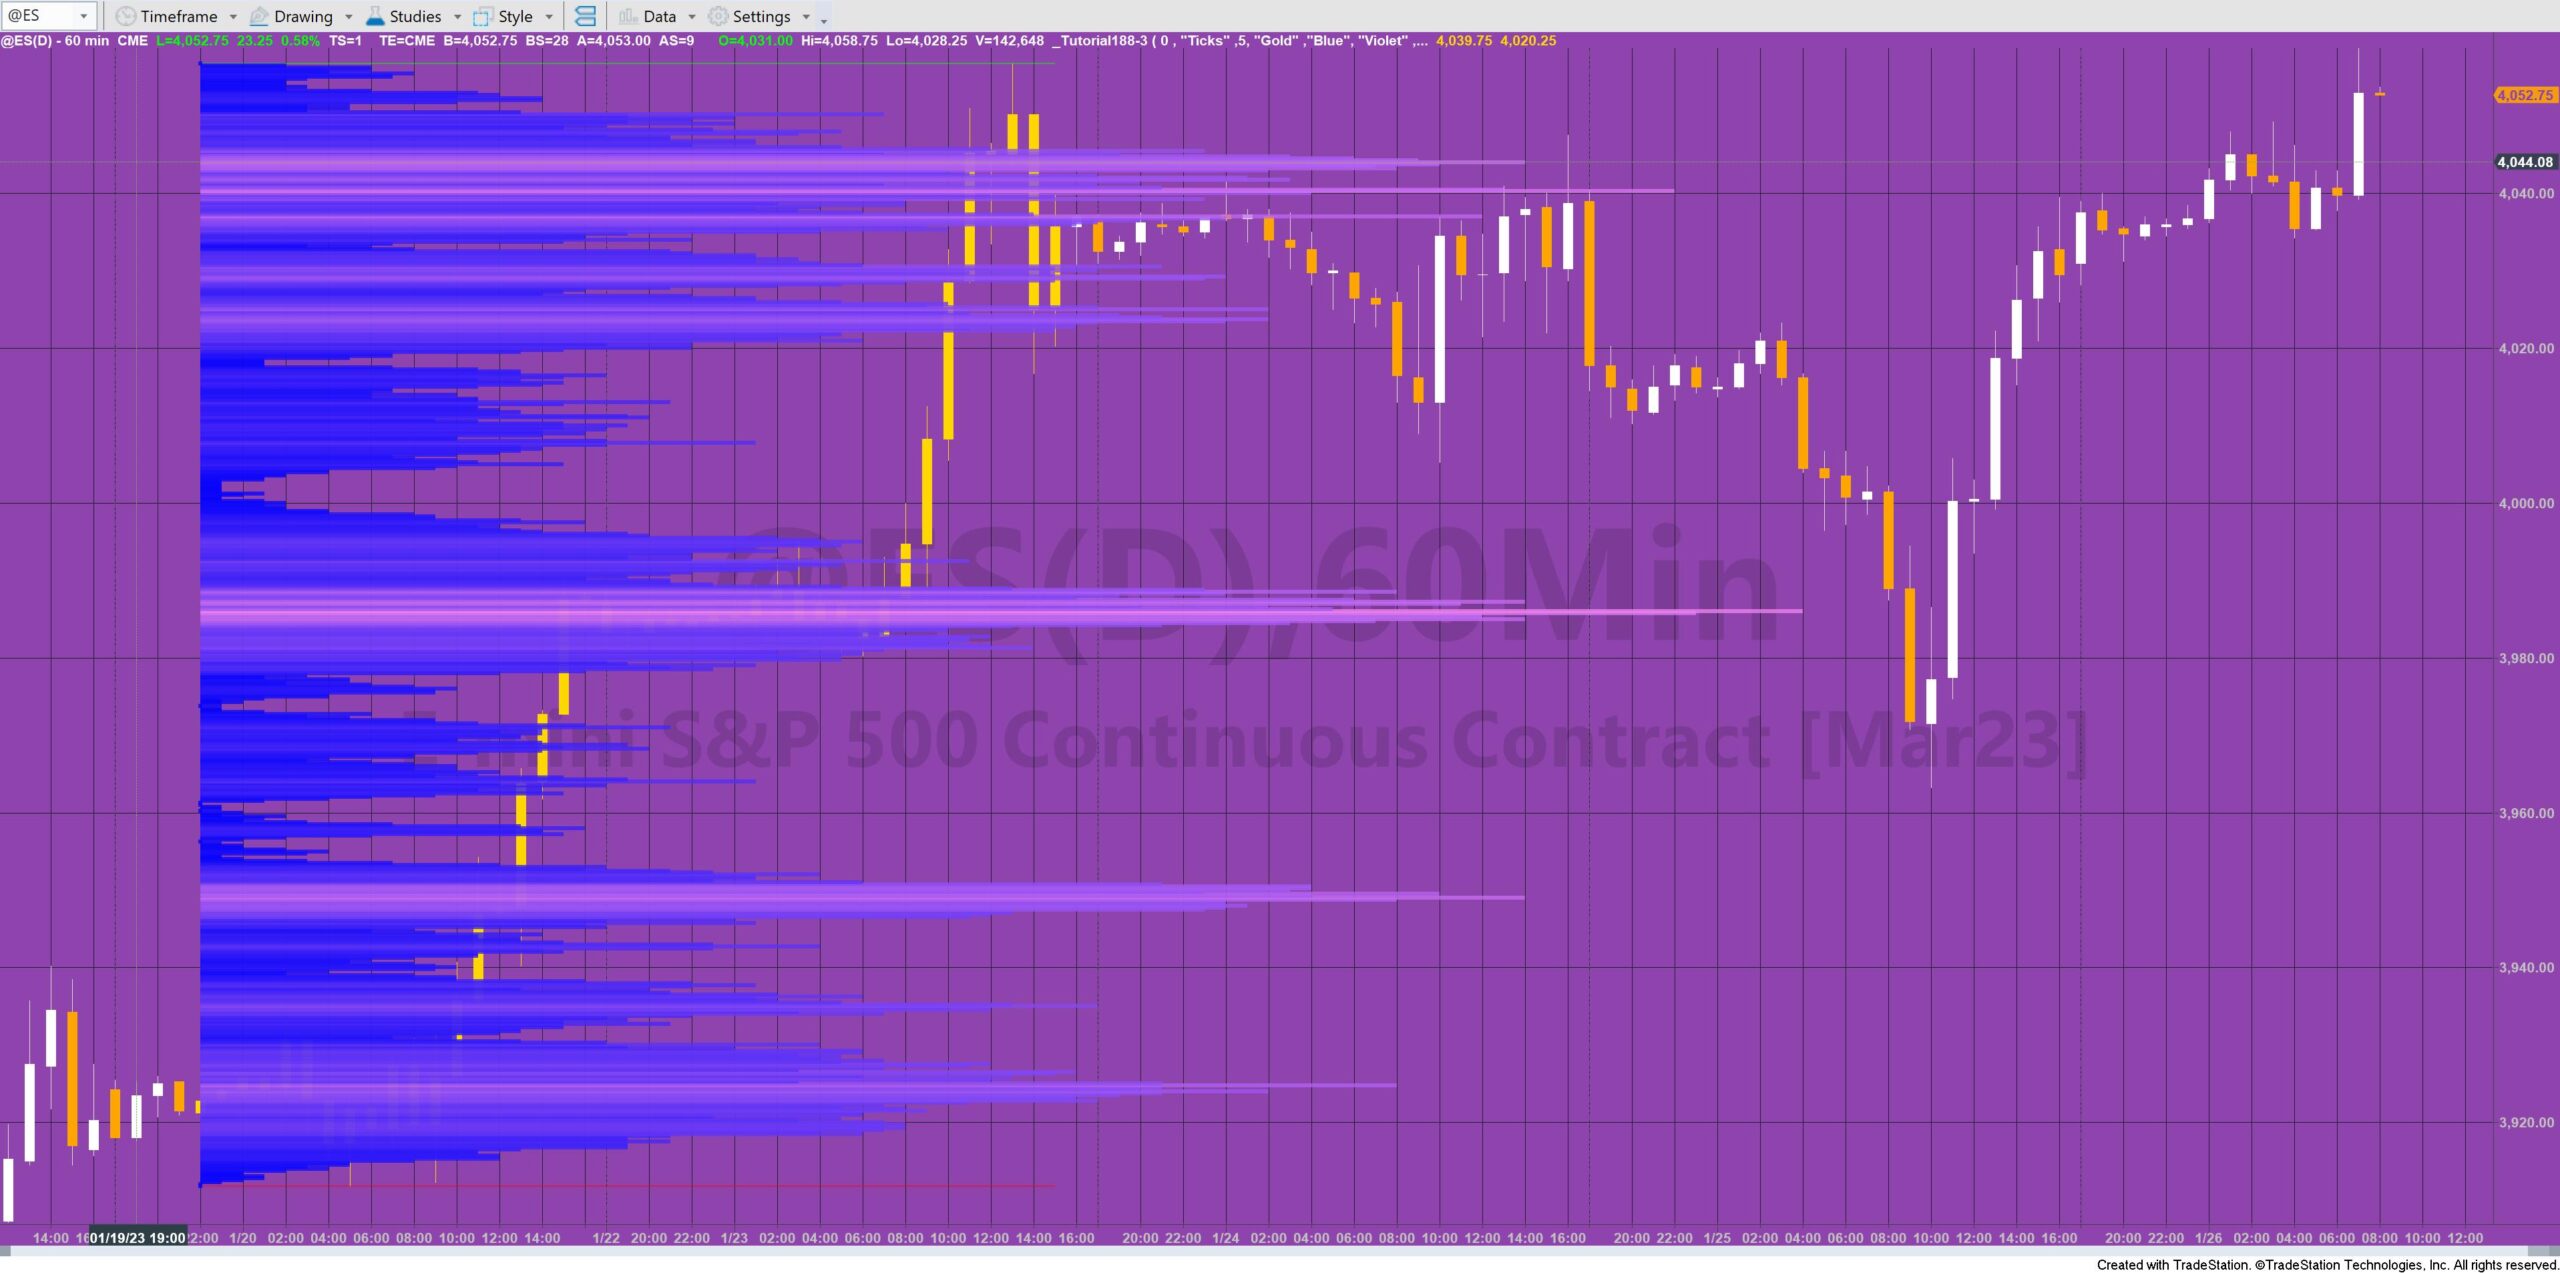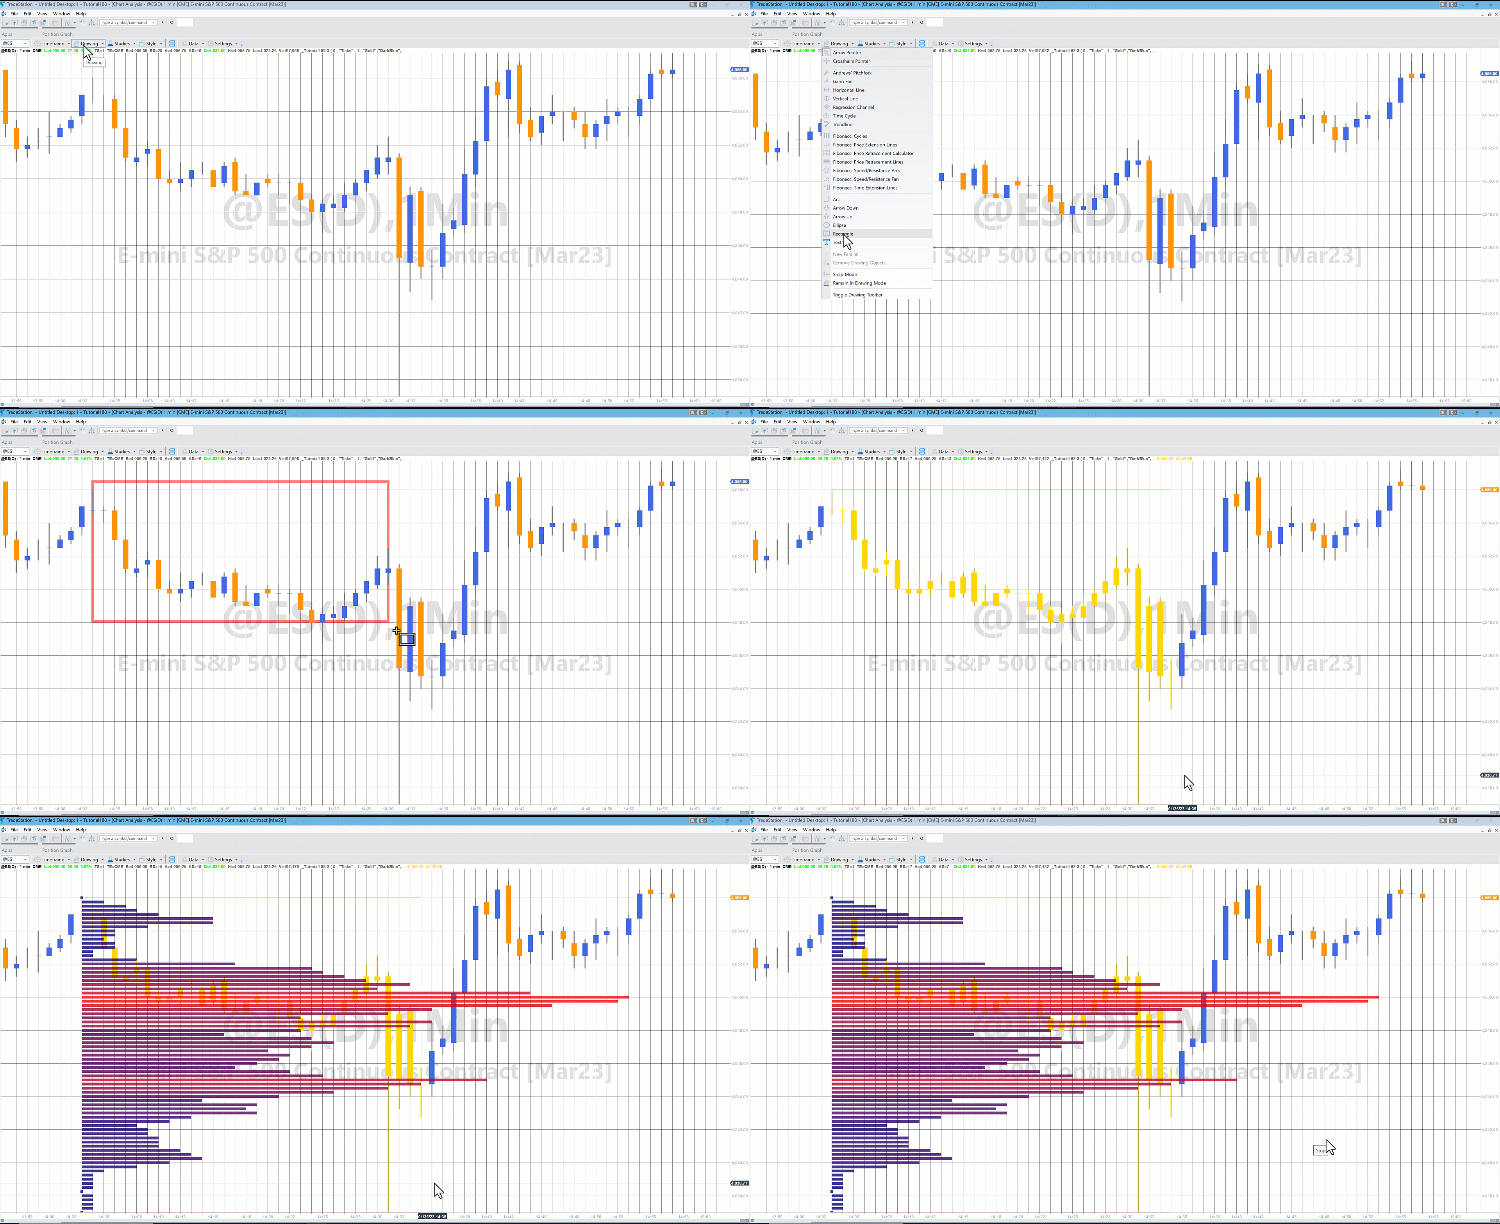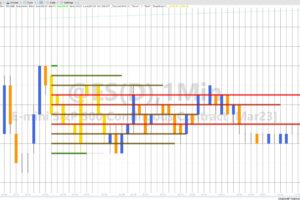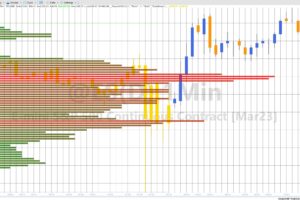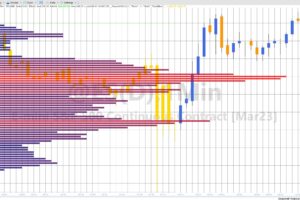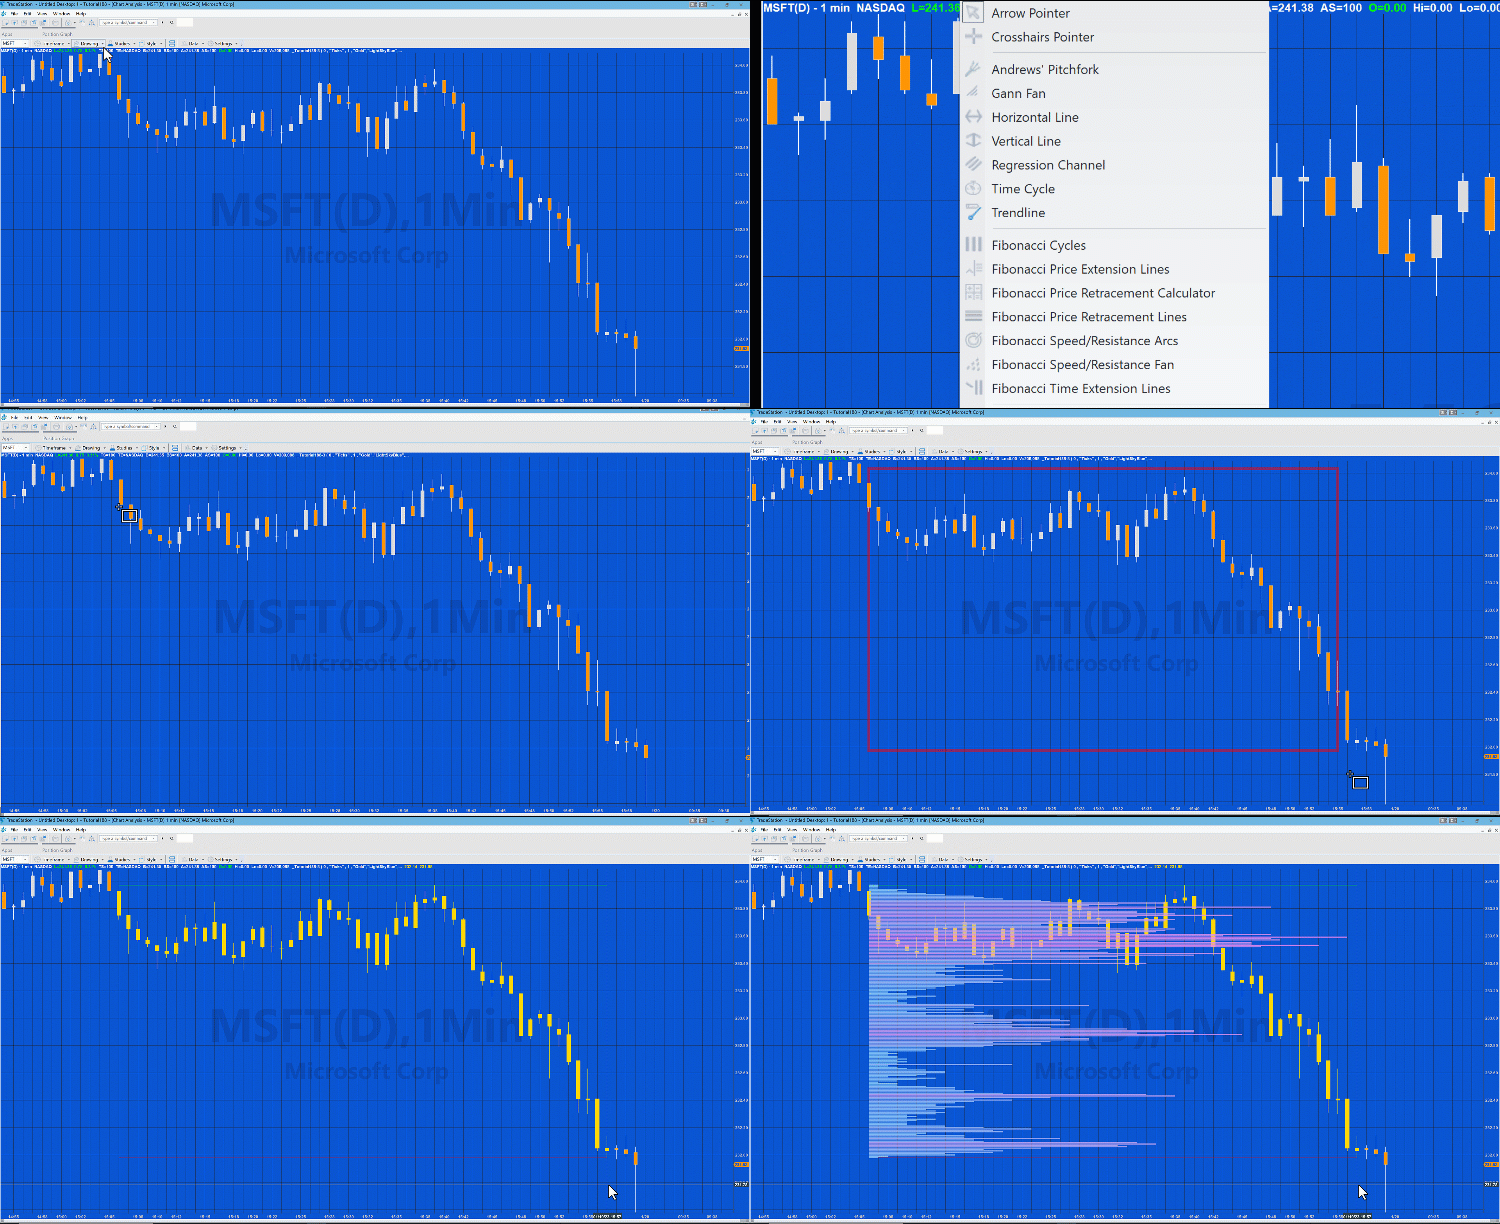
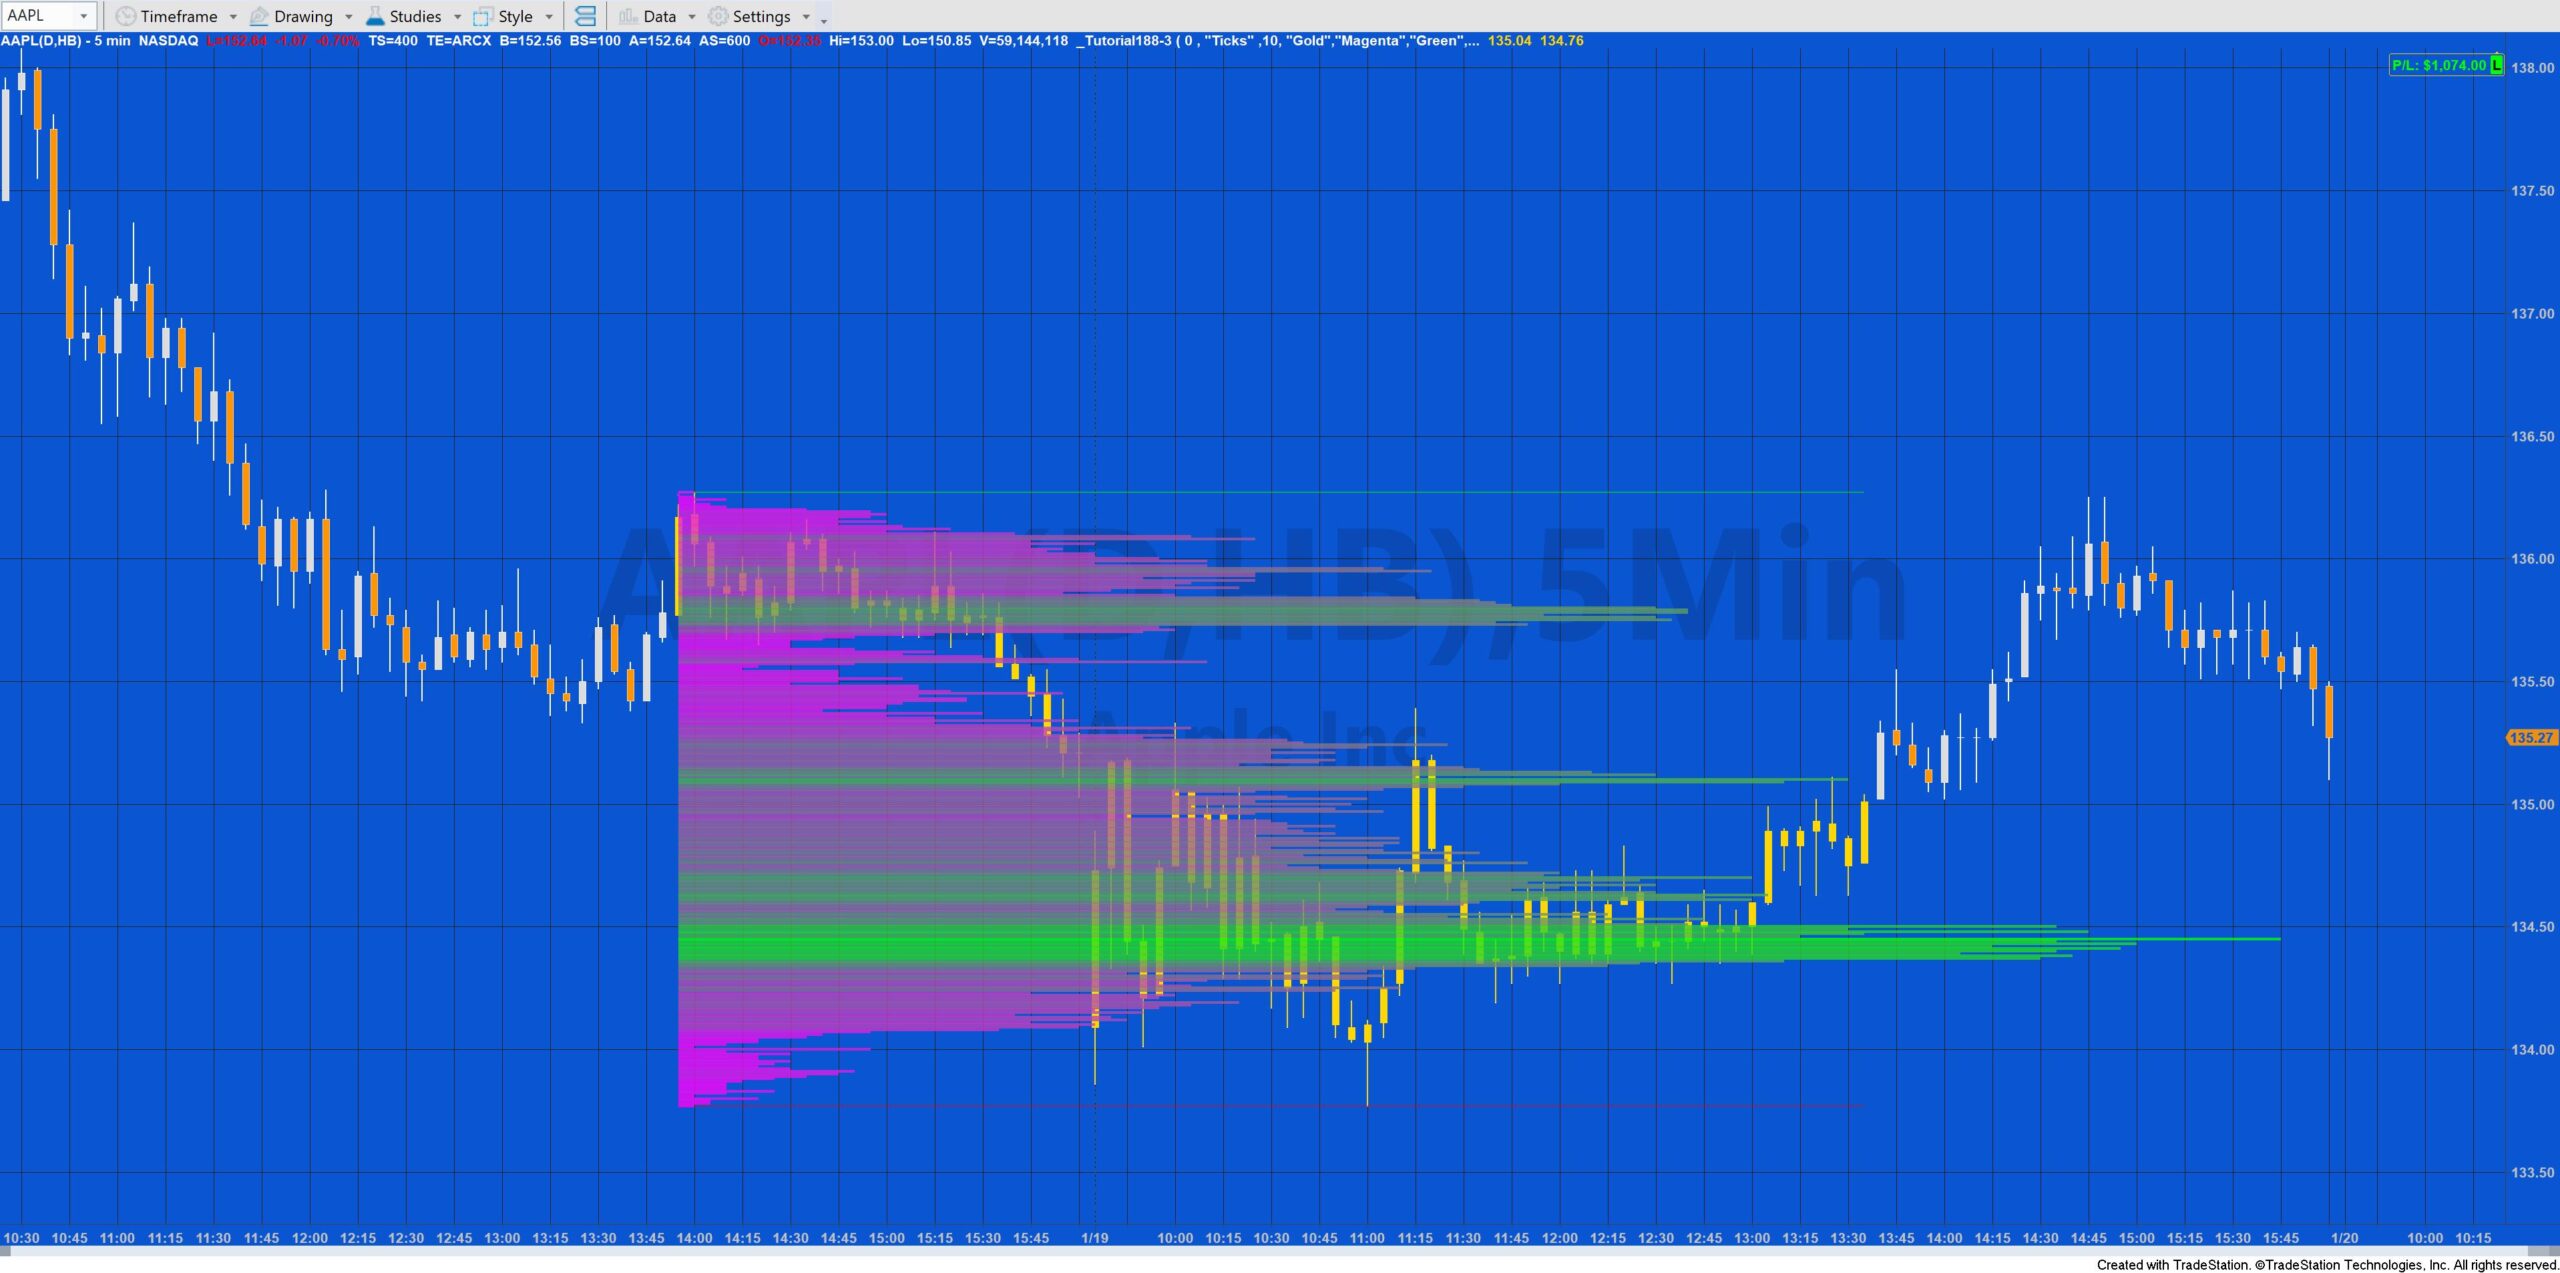
Tutorial 188 for TradeStation EasyLanguage demonstrates how to create a paintbar study that analyzes the volume profile for a number of bars that are selected by the user and then draws the volume profile on the chart. The tutorial program uses a Price Series Provider to analyze the volume profile.
The bars are selected by drawing a rectangle using the drawing tools. The tutorial program detects when a new drawing object has been added to the chart and if the drawing object is a rectangle. This uses the click event of the charting host provider. It then uses this information to work out what bars have selected. The program creates paintbars for the bars selected coloring them using the color specified by the user input: PlotCol.
It draws lines at the highest high and lowest the low of the selected bars for the period of time of the selected bars. The program calls a method to unload the price series provider: PSP (if one already exists) and then creates a new one. As part of the PSP setup a ‘change of state’ event is created.
When the price series provider’s (PSP) state indicates that the PSP is loaded, tutorial 188 analyses the PSP to create the volume profile in a dictionary named PriceVolume. In order to analyze the data as quickly as possible the PSP is first analyzed to find equivalent bars on the chart which correspond to the elements in the PSP. This data is stored in the PSPDict dictionary. For each item in the PSP, the price is converted to a string and stored in the dictionary with the values set as the volume or ticks at this price. For each new item the program checks to see if there is already an index in the dictionary with the same price, if not the new price is added otherwise the volume is added to the volume already stored in the dictionary.
The data in the PriceVolume dictionary is subsequently used to display the volume profile using trend lines. The length of each trendline is proportionate to how much volume has occurred at this price is comparison to the highest volume that occurred in the profile. The color is also varied between the lowest volume line and the highest volume line using the GradientColor function.
When using settings other than 1 tick price series provider bars, tutorial 188 assumes that all the volume/ticks took place at the closing price of the bar. Of course, in reality this is not the case so some inaccuracy in the volume profile will occur (depending on how large the user input for IntSpan is.
Important notes
The tutorial program is doing a lot of processing to calculate the profiles. The longer the bars and the smaller the value of IntSpan and whether IntType is set to “Ticks” or “Seconds” will determine how long the processing will take and even if a particular analysis will be completed. It tends to work best with smaller minute bars and smaller boxes. Too large a processing task can resort in TradeStation locking with the need to restart the computer.
In order to facilitate the highlighting of bars using the rectangle drawing tool requires that the MaxBarsBack setting is set to 500. It is therefore necessary to load enough bars to take a account of this.
The program removes all drawing objects from the chart when it is applied.
The tutorial 188 program is designed to be used with minute bar charts.
Inputs
Analysis settings
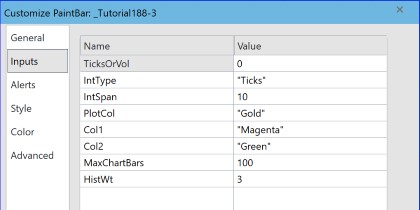
TicksOrVol: Determines whether the price series provider uses volume (set to 1) or ticks (set to 0)
IntType: The interval type, either “Ticks” or “Seconds”
IntSpan: Interval span
Display settings
PlotCol: Color of the paintbars plotted within the rectangle
Col1: Color for lowest volumes in profile
Col2: Color for highest volume in profile
MaxChartBars: The maximum width of profile counted in bars
HistWt: The thickness of the histogram bars (0 to 6)
All colors are entered as the names of color classes. See the options below.
Explanation of tutorial 188 inputs
Explanation of tutorial 188
The tutorial is not compatible with MultiCharts.
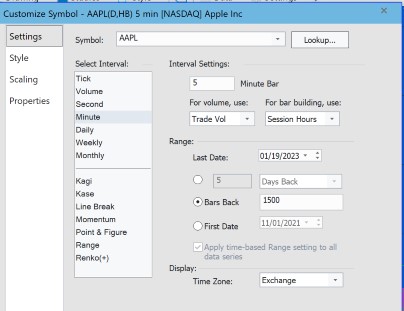
Example settings for 5 minute AAPL chart
Valid color options
| AliceBlue | DarkSlateGray | LightSalmon | PaleVioletRed |
| AntiqueWhite | DarkTurquoise | LightSeaGreen | PapayaWhip |
| Aqua | DarkViolet | LightSkyBlue | PeachPuff |
| Aquamarine | DeepPink | LightSlateGray | Peru |
| Azure | DeepSkyBlue | LightSteelBlue | Pink |
| Beige | DimGray | LightYellow | Plum |
| Bisque | DodgerBlue | Lime | PowderBlue |
| Black | Firebrick | LimeGreen | Purple |
| BlanchedAlmond | FloralWhite | Linen | Red |
| Blue | ForestGreen | Magenta | RosyBrown |
| BlueViolet | Fuschia | Maroon | RoyalBlue |
| Brown | Gainsboro | MediumAquamarine | SaddleBrown |
| Burlywood | GhostWhite | MediumBlue | Salmon |
| CadetBlue | Gold | MediumOrchid | SandyBrown |
| Chartreuse | Goldenrod | MediumPurple | SeaGreen |
| Chocolate | Gray | MediumSeaGreen | Seashell |
| Coral | Green | MediumSlateBlue | Sienna |
| CornflowerBlue | GreenYellow | MediumSpringGreen | Silver |
| Cornsilk | Honeydew | MediumTurquoise | SkyBlue |
| Cyan | HotPink | MediumVioletRed | SlateBlue |
| DarkBlue | IndianRed | MidnightBlue | SlateGray |
| DarkBrown | Indigo | MintCream | Snow |
| DarkCyan | Ivory | MistyRose | SpringGreen |
| DarkGoldenrod | Khaki | Moccasin | SteelBlue |
| DarkGray | Lavender | NavajoWhite | Tan |
| DarkGreen | LavenderBlush | Navy | Teal |
| DarkKhaki | LawnGreen | OldLace | Thistle |
| Dark Magenta | LemonChiffon | Olive | Tomato |
| DarkOliveGreen | LightBlue | OliveDrab | Turquoise |
| DarkOrange | LightCoral | Orange | Violet |
| DarkOrchid | LightCyan | OrangeRed | Wheat |
| DarkRed | LightGoldenrodYellow | Orchid | White |
| DarkSalmon | LightGray | PaleGoldenrod | WhiteSmoke |
| DarkSeaGreen | LightGreen | PaleGreen | Yellow |
| DarkSlateBlue | LightPink | PaleTurquoise | YellowGreen |
TO THE BEST OF MARKPLEX CORPORATION’S KNOWLEDGE, ALL OF THE INFORMATION ON THIS PAGE IS CORRECT, AND IT IS PROVIDED IN THE HOPE THAT IT WILL BE USEFUL. HOWEVER, MARKPLEX CORPORATION ASSUMES NO LIABILITY FOR ANY DAMAGES, DIRECT OR OTHERWISE, RESULTING FROM THE USE OF THIS INFORMATION AND/OR PROGRAM(S) DESCRIBED, AND NO WARRANTY IS MADE REGARDING ITS ACCURACY OR COMPLETENESS. USE OF THIS INFORMATION AND/OR PROGRAMS DESCRIBED IS AT YOUR OWN RISK.
ANY EASYLANGUAGE OR POWERLANGUAGE TRADING STRATEGIES, SIGNALS, STUDIES, INDICATORS, SHOWME STUDIES, PAINTBAR STUDIES, PROBABILITYMAP STUDIES, ACTIVITYBAR STUDIES, FUNCTIONS (AND PARTS THEREOF) AND ASSOCIATED TECHNIQUES REFERRED TO, INCLUDED IN OR ATTACHED TO THIS TUTORIAL OR PROGRAM DESCRIPTION ARE EXAMPLES ONLY, AND HAVE BEEN INCLUDED SOLELY FOR EDUCATIONAL PURPOSES. MARKPLEX CORPORATION. DOES NOT RECOMMEND THAT YOU USE ANY SUCH TRADING STRATEGIES, SIGNALS, STUDIES, INDICATORS, SHOWME STUDIES, PAINTBAR STUDIES, PROBABILITYMAP STUDIES, ACTIVITYBAR STUDIES, FUNCTIONS (OR ANY PARTS THEREOF) OR TECHNIQUES. THE USE OF ANY SUCH TRADING STRATEGIES, SIGNALS, STUDIES, INDICATORS, SHOWME STUDIES, PAINTBAR STUDIES, PROBABILITYMAP STUDIES, ACTIVITYBAR STUDIES, FUNCTIONS AND TECHNIQUES DOES NOT GUARANTEE THAT YOU WILL MAKE PROFITS, INCREASE PROFITS, OR MINIMIZE LOSSES.

