Bundled version of tutorial 192
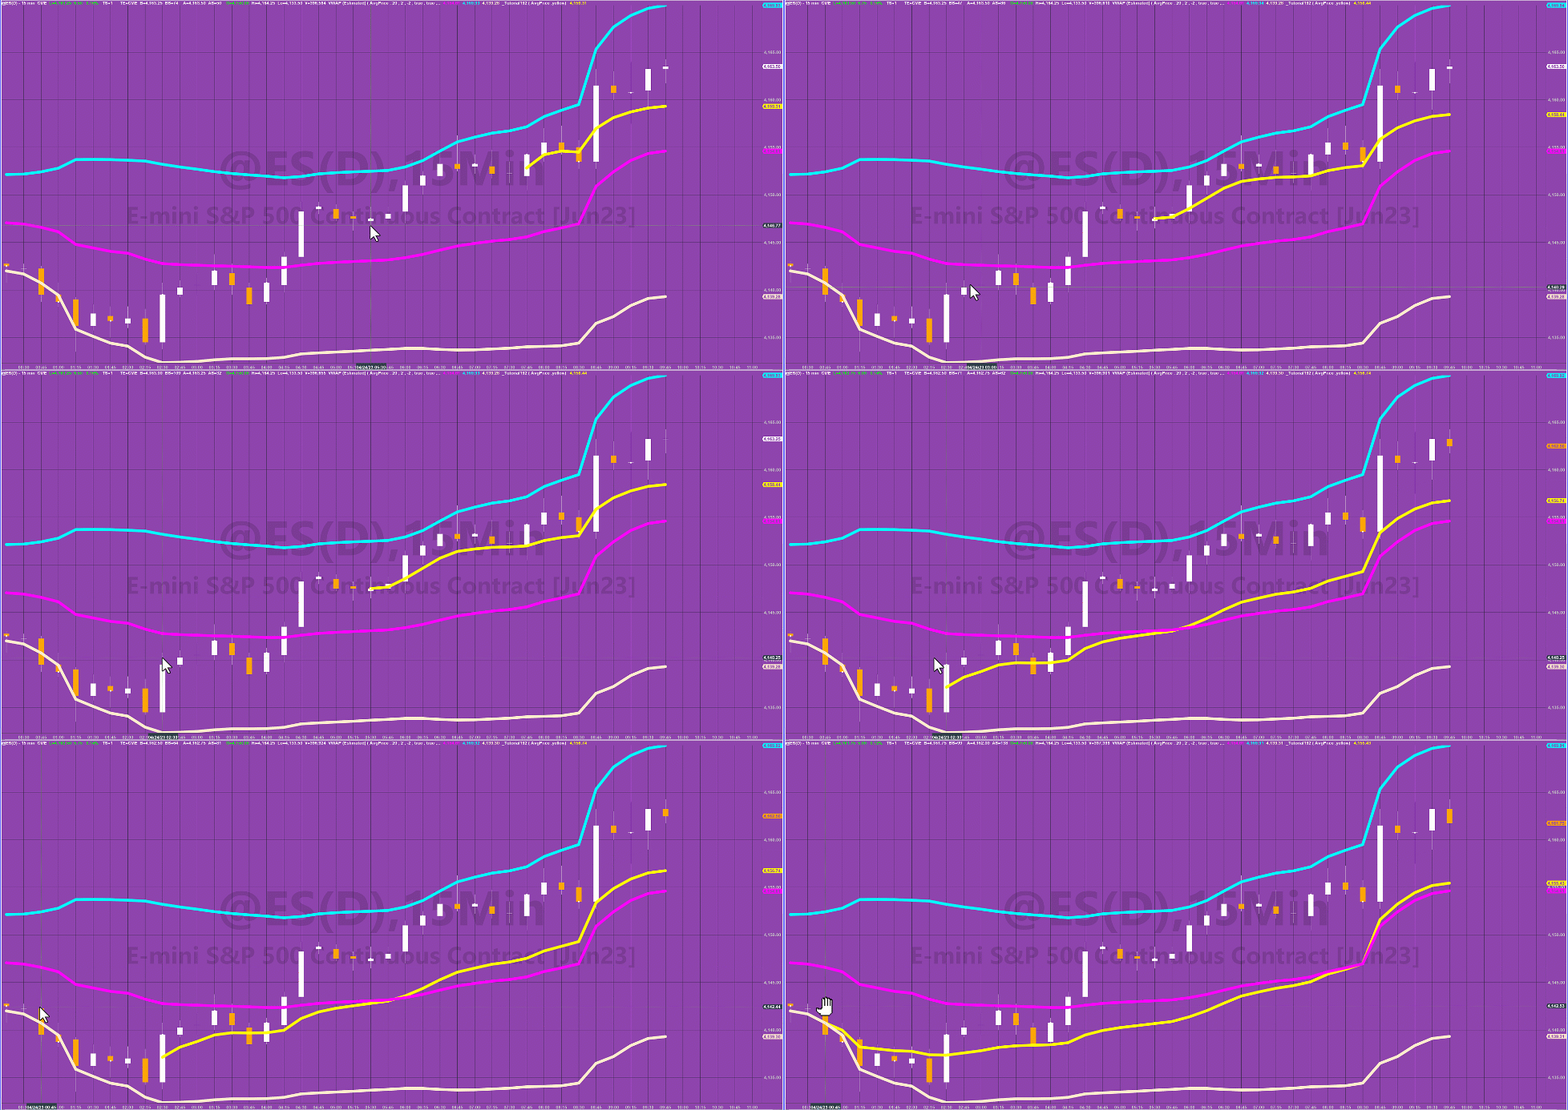
Note: the cyan, pink lines and magenta lines are plotted by the standard TradeStation VWAP (estimated) indicator. The yellow lines are plotted by tutorial 192.
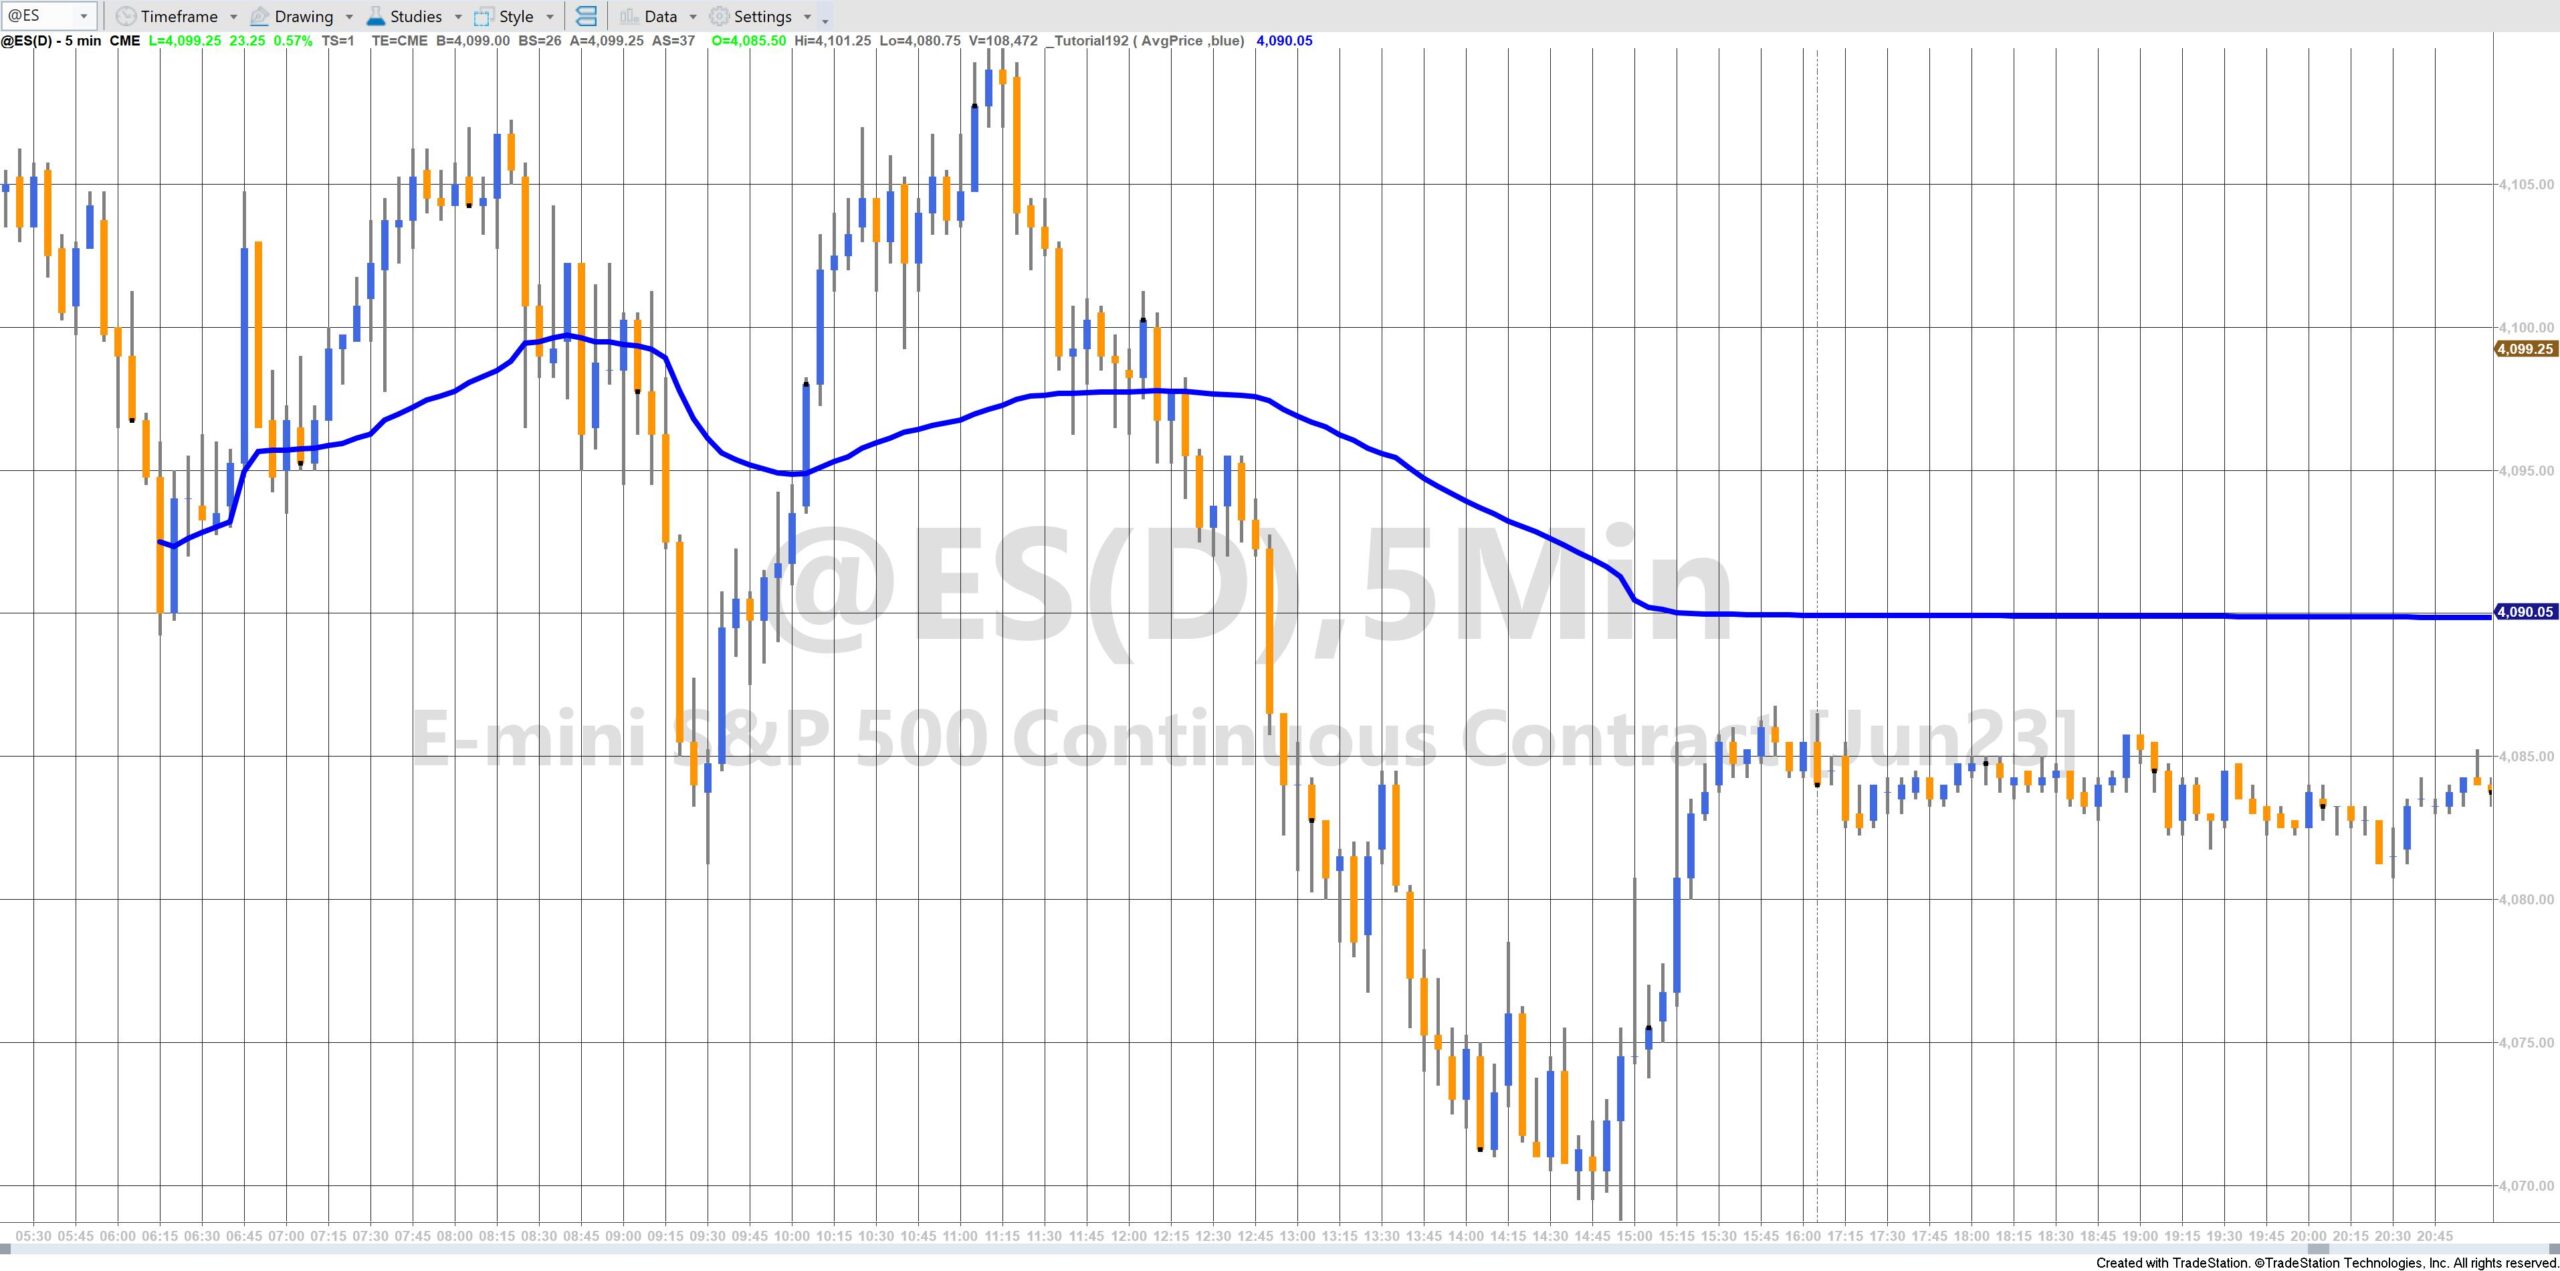
Tutorial 192 demonstrates how to create an Anchored Volume Weighted Average Price (estimated) indicator.
A Volume Weighted Average Price or VWAP is calculated by summing the volume multiplied by price, summing the volume and then dividing the former by the latter. This is an estimated value because the calculation is assuming that all the volume occurs at the ‘price’, by default this is set to the average price for the bar. The ‘anchored’ means that the line is calculated from the bar that was clicked (compared to being calculated from the beginning of the day, or the start of a new session).
This tutorial is not compatible with MultiCharts because it uses the Charting Host provider.
The tutorial program can be downloaded for free by Gold Pass members (see below).
Technical lessons include:
- How to clear a previous plot
- Detecting when a bar is clicked using the Charting Host
- ‘Maximum bars Study will reference’ and why the study is restarted when clicking older bars
- Updating the plot for the bar currently being formed (and future bars)
- EasyLanguage reserved words related to Ticks and Volume
- Intrabarpersist variables

Explanation of tutorial 192
Overview and summary of the tutorial code
Tutorial 192 demonstrates how to create a program to calculate and plot an “anchored” VWAP (Volume Weighted Average price.
The tutorial uses the Charting Host to detect when a bar is clicked and the number of bars ago that the bar was clicked. With this information it firstly clears any Anchored VWAP that was previously plotted. It then, starting at the bar that was clicked, calculates and plots the Anchored VWAP.
The calculation is continued for real time bars.
 As was demonstrated in the video, the tutorial program can be used with “Maximum Number of Bars Study will Reference” set to auto-detect. If this is used and a bar is clicked the program will reload and recalculate in order to set the maximum number of bars. The bar must be clicked again to calculate and plot the Anchored VWAP.
Free Gold Pass download of the tutorial 192 code
If you are a Gold Pass member you can download the tutorial 192 program for free. (Make sure that you are logged into Gold Pass): Original tutorial program: ![]() This content is for members only. Tutorial program that includes plots of standard deviations:
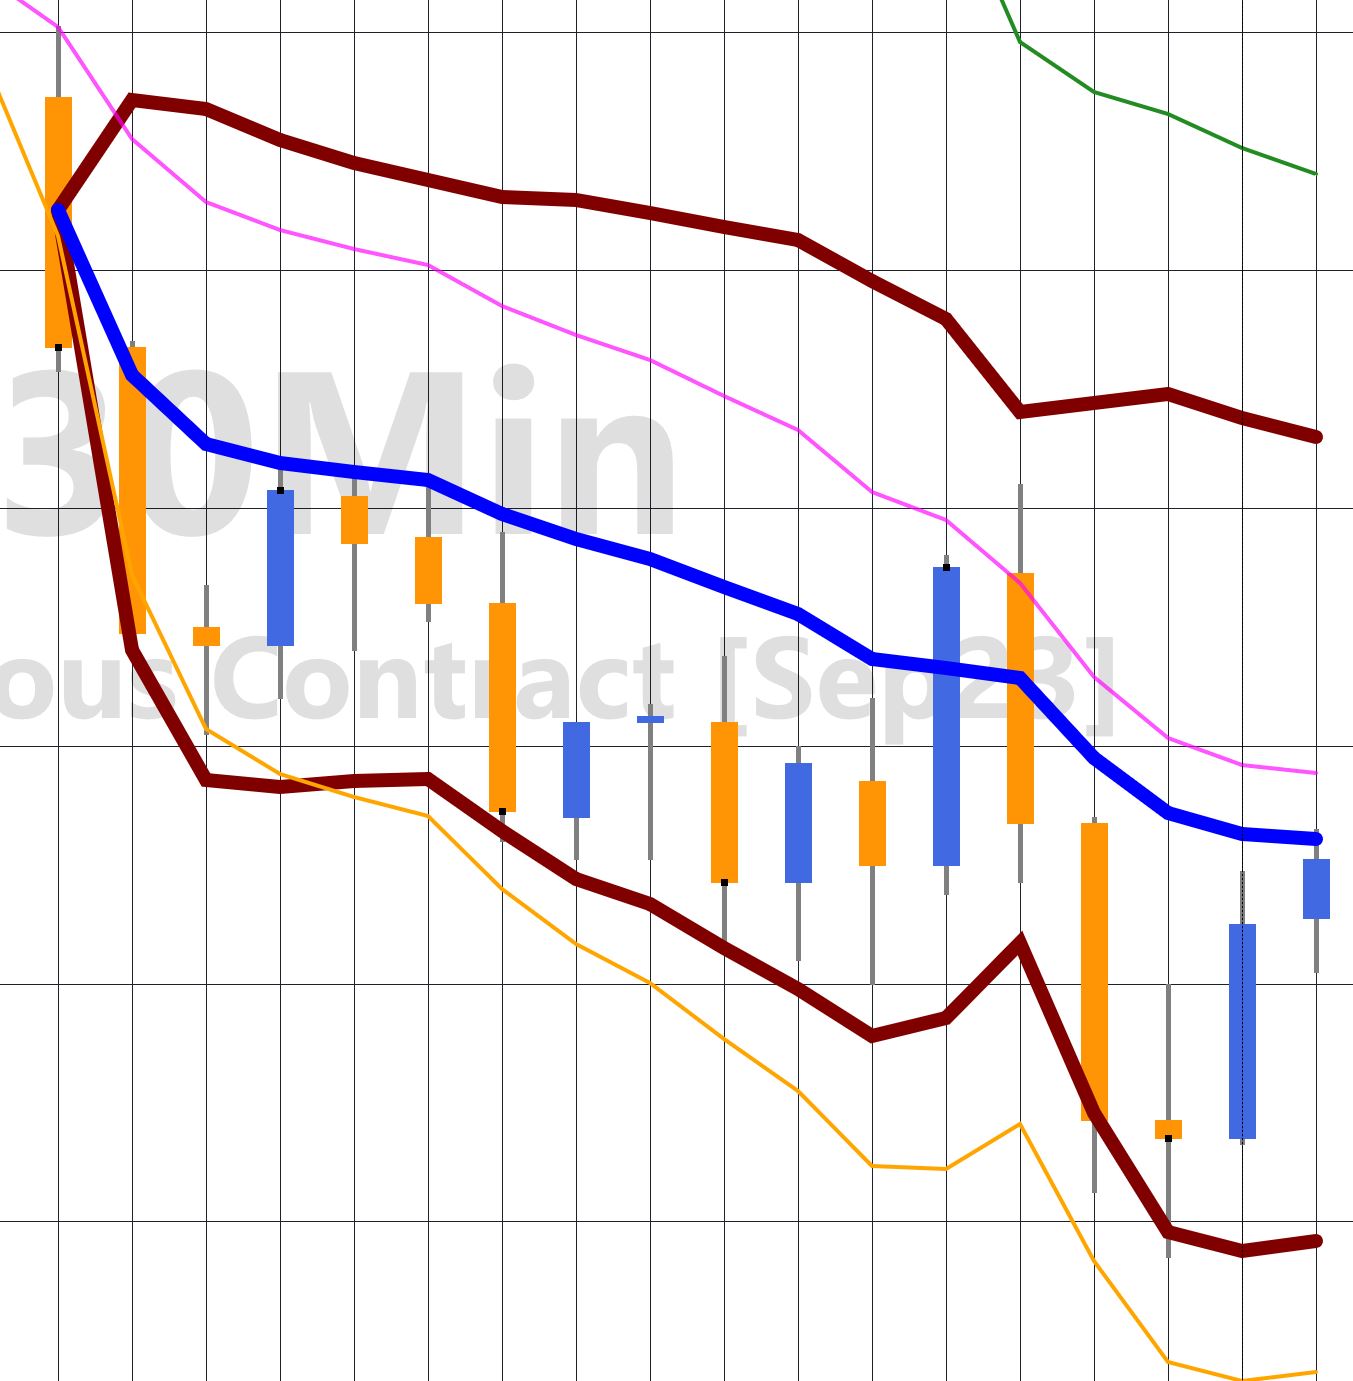
This content is for members only. Tutorial program that includes plots of standard deviations:
The tutorial is NOT compatible with MultiCharts.

TO THE BEST OF MARKPLEX CORPORATION’S KNOWLEDGE, ALL OF THE INFORMATION ON THIS PAGE IS CORRECT, AND IT IS PROVIDED IN THE HOPE THAT IT WILL BE USEFUL. HOWEVER, MARKPLEX CORPORATION ASSUMES NO LIABILITY FOR ANY DAMAGES, DIRECT OR OTHERWISE, RESULTING FROM THE USE OF THIS INFORMATION AND/OR PROGRAM(S) DESCRIBED, AND NO WARRANTY IS MADE REGARDING ITS ACCURACY OR COMPLETENESS. USE OF THIS INFORMATION AND/OR PROGRAMS DESCRIBED IS AT YOUR OWN RISK.
ANY EASYLANGUAGE OR POWERLANGUAGE TRADING STRATEGIES, SIGNALS, STUDIES, INDICATORS, SHOWME STUDIES, PAINTBAR STUDIES, PROBABILITYMAP STUDIES, ACTIVITYBAR STUDIES, FUNCTIONS (AND PARTS THEREOF) AND ASSOCIATED TECHNIQUES REFERRED TO, INCLUDED IN OR ATTACHED TO THIS TUTORIAL OR PROGRAM DESCRIPTION ARE EXAMPLES ONLY, AND HAVE BEEN INCLUDED SOLELY FOR EDUCATIONAL PURPOSES. MARKPLEX CORPORATION. DOES NOT RECOMMEND THAT YOU USE ANY SUCH TRADING STRATEGIES, SIGNALS, STUDIES, INDICATORS, SHOWME STUDIES, PAINTBAR STUDIES, PROBABILITYMAP STUDIES, ACTIVITYBAR STUDIES, FUNCTIONS (OR ANY PARTS THEREOF) OR TECHNIQUES. THE USE OF ANY SUCH TRADING STRATEGIES, SIGNALS, STUDIES, INDICATORS, SHOWME STUDIES, PAINTBAR STUDIES, PROBABILITYMAP STUDIES, ACTIVITYBAR STUDIES, FUNCTIONS AND TECHNIQUES DOES NOT GUARANTEE THAT YOU WILL MAKE PROFITS, INCREASE PROFITS, OR MINIMIZE LOSSES.


