TradeStation drawing tools can be useful to display information. They can also be used as part of the functionality of a program. For example, you might draw a trend line that indicates to the program the price level in which to enter or stop out of a trade, or on which bar to enter or exit a trade. The same can be true for text labels.
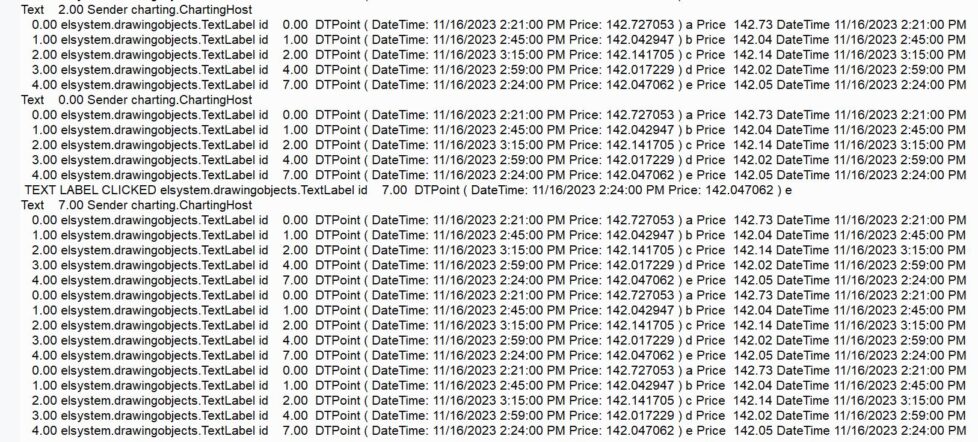
Tutorial199 demonstrates how to detect when a new text label is drawn on the chart by the user. The program then adds a click event to the text label and prints out information about all the text labels that have been added to the chart. The information printed is:
- the text label string,
- the DTPoint value of the text converted to a string,
- the price and
- the datetime.
Because the click event has been set up for the string, it is able to detect when it is clicked. When a text label to selected by down clicking on it, the click event prints the following:
- the string of the text,
- the ID of the text object and
- the price.
A major part of the functionality of this tutorial is the Charting Host. A once statement that runs on the last bar creates the ChartingHost and an event that detects when the chart is clicked.
The once statement also stores all the existing text labels that have been created using the drawing tools in a vector. It then goes through the text labels and adds click event to each of them. This is done because, normally in this tutorial program, click events are added to text labels as they are added to the chart, however these need to be added to any user added text objects that are on the chart when the tutorial 199 is first added to the chart (or reapplied).
Watch the video below for a full explanation.
Explanation of tutorial 199
TO THE BEST OF MARKPLEX CORPORATION’S KNOWLEDGE, ALL OF THE INFORMATION ON THIS PAGE IS CORRECT, AND IT IS PROVIDED IN THE HOPE THAT IT WILL BE USEFUL. HOWEVER, MARKPLEX CORPORATION ASSUMES NO LIABILITY FOR ANY DAMAGES, DIRECT OR OTHERWISE, RESULTING FROM THE USE OF THIS INFORMATION AND/OR PROGRAM(S) DESCRIBED, AND NO WARRANTY IS MADE REGARDING ITS ACCURACY OR COMPLETENESS. USE OF THIS INFORMATION AND/OR PROGRAMS DESCRIBED IS AT YOUR OWN RISK.
ANY EASYLANGUAGE OR POWERLANGUAGE TRADING STRATEGIES, SIGNALS, STUDIES, INDICATORS, SHOWME STUDIES, PAINTBAR STUDIES, PROBABILITYMAP STUDIES, ACTIVITYBAR STUDIES, FUNCTIONS (AND PARTS THEREOF) AND ASSOCIATED TECHNIQUES REFERRED TO, INCLUDED IN OR ATTACHED TO THIS TUTORIAL OR PROGRAM DESCRIPTION ARE EXAMPLES ONLY, AND HAVE BEEN INCLUDED SOLELY FOR EDUCATIONAL PURPOSES. MARKPLEX CORPORATION. DOES NOT RECOMMEND THAT YOU USE ANY SUCH TRADING STRATEGIES, SIGNALS, STUDIES, INDICATORS, SHOWME STUDIES, PAINTBAR STUDIES, PROBABILITYMAP STUDIES, ACTIVITYBAR STUDIES, FUNCTIONS (OR ANY PARTS THEREOF) OR TECHNIQUES. THE USE OF ANY SUCH TRADING STRATEGIES, SIGNALS, STUDIES, INDICATORS, SHOWME STUDIES, PAINTBAR STUDIES, PROBABILITYMAP STUDIES, ACTIVITYBAR STUDIES, FUNCTIONS AND TECHNIQUES DOES NOT GUARANTEE THAT YOU WILL MAKE PROFITS, INCREASE PROFITS, OR MINIMIZE LOSSES.

