

Tutorial 216 demonstrates how to write an EasyLanguage program in TradeStation that displays the real time volume for the bar that’s being formed, the volume for the previous bar and the volume of the three previous bars before that. The information is positioned towards the top of the chart and colored rectangles are placed behind the text.
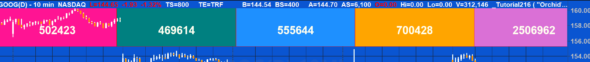
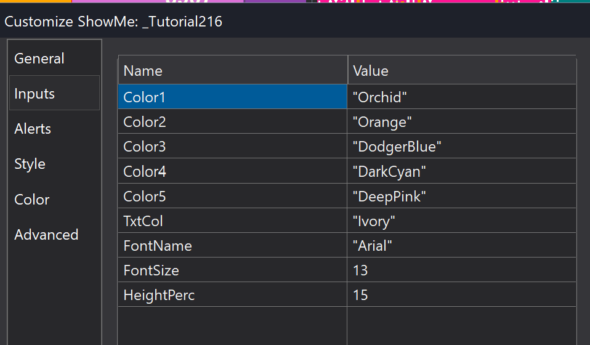
User inputs determine the color of the boxes, the size, color and name of the font and the height of the colored boxes.
The initial setup is done in a once statement. The charting host, and two vectors: TextVect, where the text objects are stored and BoxVect where the rectangles are stored. The rectangles are initially drawn using a method named DrawRectangle. The text and rectangles are created and positioned using XYPoints. The XYPoint class is used to define a drawing object (Ellipse, Rectangle, or TextLabel) point based on a chart X and Y location (relative to the upper left corner of the chart) expressed as the number of pixels. Drawing objects positioned with an XYPoint will not move with the bars when the chart is scrolled.
The attributes of the text (i.e. font, font size, color of text and color of the rectangles) is also set up at this time. The available colors have been included below. The text objects are stored in a vector (TextVect) and the rectangles are stored in another vector (BoxVect). By using the vectors in conjunction with For loops means that the program can be made more compact.
Two ChartingHost events are used to detect when the chart is initialized and also when the chart is resized. If such an event has fired, the start and XY end points of the rectangles are adjusted and the position of text is changed. The value of volume is continually updated.
Anyone using this program should become familiar with EasyLanguage reserved words related to ticks, volume & open Interest as the meaning of these keywords is different depending on context. For example, this tutorial has hard coded the ‘ticks’ keyword in the program. This represents total volume when the program is applied to a stock symbol, “Trade vol” has been selected in the symbol settings and the bars are intraday (Time-based, Tick-based, or Volume-based Bars).

Explanation of tutorial 216
Download the tutorial 216 show me study
If you wish to save yourself some typing, the tutorial is available for immediate download by clicking the ‘add to cart’ button below. You may pay using PayPal or a credit card. The price is $24.95
TO THE BEST OF MARKPLEX CORPORATION’S KNOWLEDGE, ALL OF THE INFORMATION ON THIS PAGE IS CORRECT, AND IT IS PROVIDED IN THE HOPE THAT IT WILL BE USEFUL. HOWEVER, MARKPLEX CORPORATION ASSUMES NO LIABILITY FOR ANY DAMAGES, DIRECT OR OTHERWISE, RESULTING FROM THE USE OF THIS INFORMATION AND/OR PROGRAM(S) DESCRIBED, AND NO WARRANTY IS MADE REGARDING ITS ACCURACY OR COMPLETENESS. USE OF THIS INFORMATION AND/OR PROGRAMS DESCRIBED IS AT YOUR OWN RISK.
ANY EASYLANGUAGE OR POWERLANGUAGE TRADING STRATEGIES, SIGNALS, STUDIES, INDICATORS, SHOWME STUDIES, PAINTBAR STUDIES, PROBABILITYMAP STUDIES, ACTIVITYBAR STUDIES, FUNCTIONS (AND PARTS THEREOF) AND ASSOCIATED TECHNIQUES REFERRED TO, INCLUDED IN OR ATTACHED TO THIS TUTORIAL OR PROGRAM DESCRIPTION ARE EXAMPLES ONLY, AND HAVE BEEN INCLUDED SOLELY FOR EDUCATIONAL PURPOSES. MARKPLEX CORPORATION. DOES NOT RECOMMEND THAT YOU USE ANY SUCH TRADING STRATEGIES, SIGNALS, STUDIES, INDICATORS, SHOWME STUDIES, PAINTBAR STUDIES, PROBABILITYMAP STUDIES, ACTIVITYBAR STUDIES, FUNCTIONS (OR ANY PARTS THEREOF) OR TECHNIQUES. THE USE OF ANY SUCH TRADING STRATEGIES, SIGNALS, STUDIES, INDICATORS, SHOWME STUDIES, PAINTBAR STUDIES, PROBABILITYMAP STUDIES, ACTIVITYBAR STUDIES, FUNCTIONS AND TECHNIQUES DOES NOT GUARANTEE THAT YOU WILL MAKE PROFITS, INCREASE PROFITS, OR MINIMIZE LOSSES.