Disclaimer:
The content presented in this video and on this web page is for educational and informational purposes only. The classification of ETFs into “growth-oriented” or “defensive” groups is based solely on typical sector behavior and market convention.
This does not imply that any specific ETF is safer, more stable, or more likely to grow in value than another.
Always perform your own due diligence and consult a qualified financial advisor before making investment decisions.
The tutorial is NOT compatible with MultiCharts.
The program has been thoroughly tested, however, please report any software bugs.
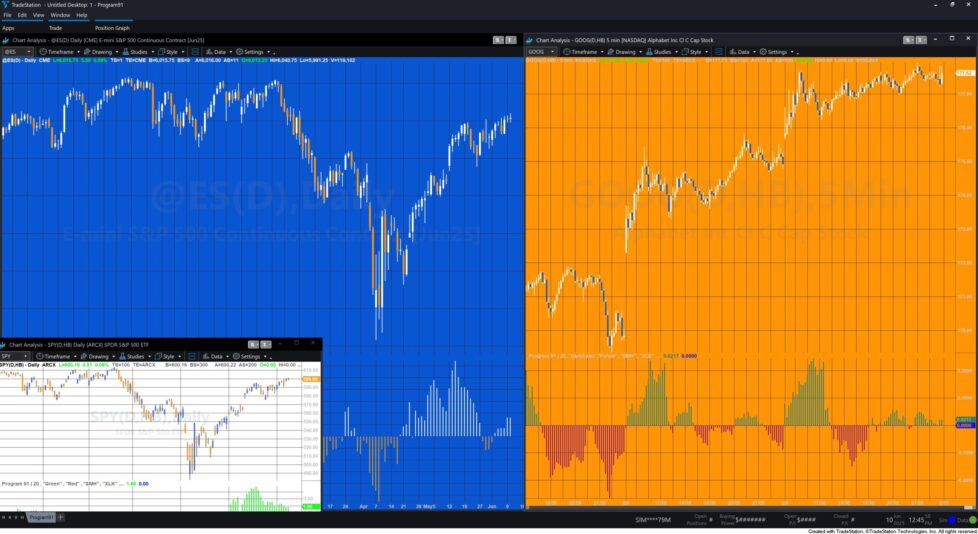
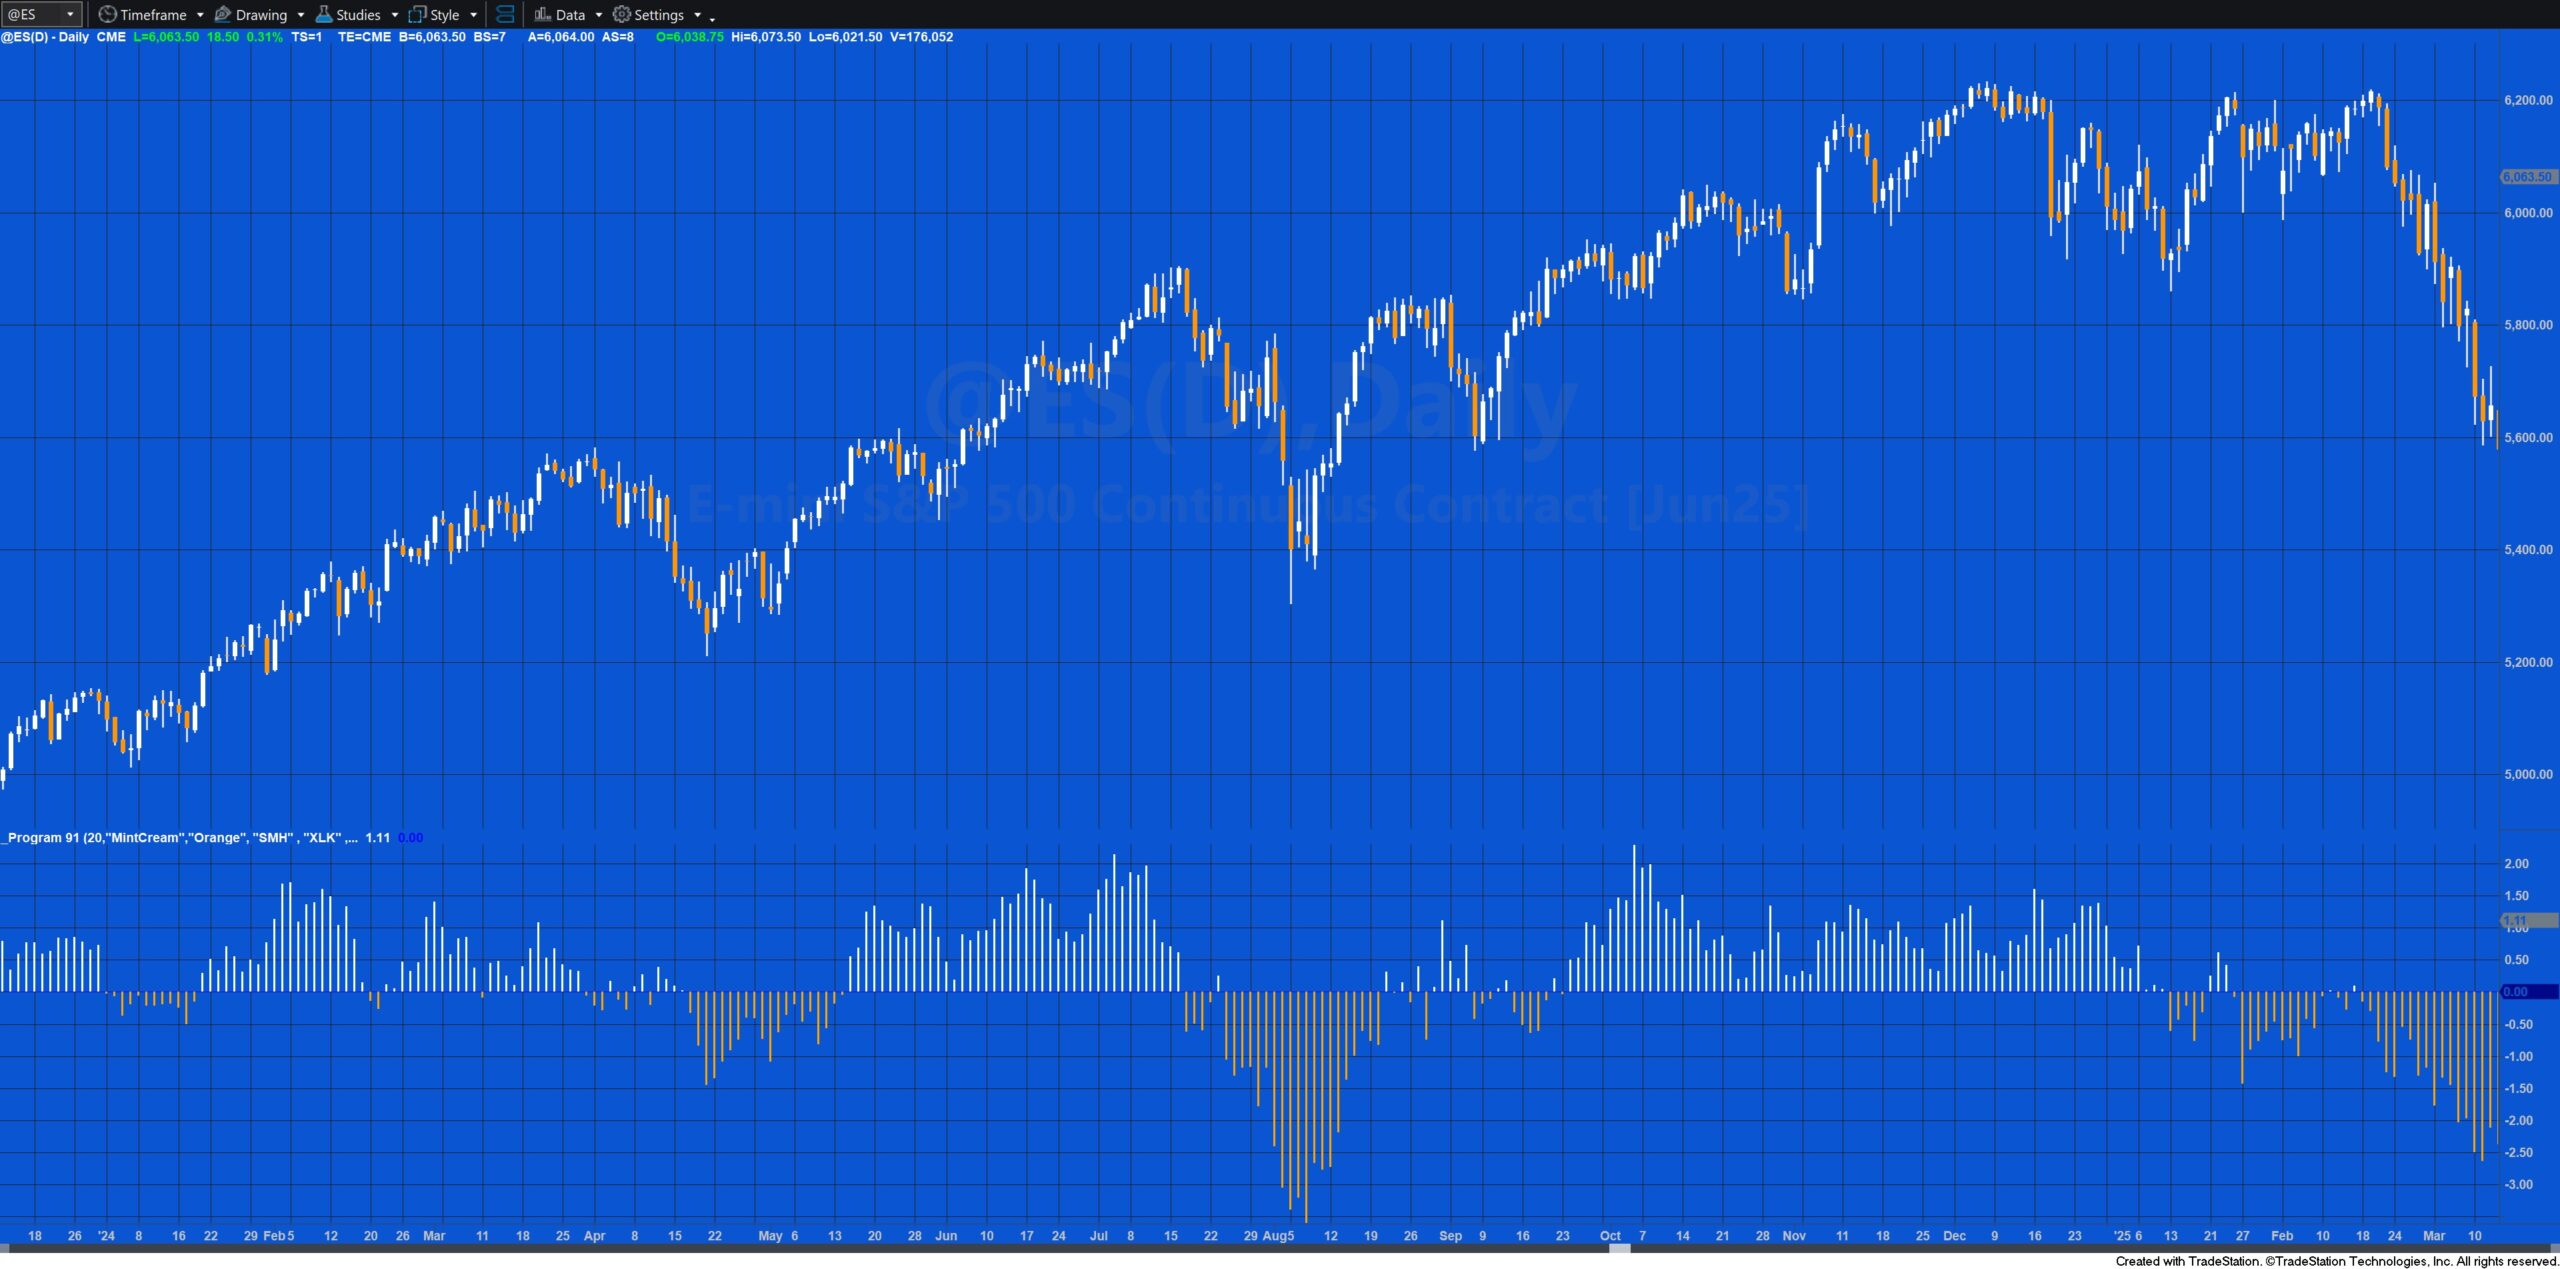
 Program 91 is a TradeStation EasyLanguage indicator that gauges market risk sentiment by comparing what might be considered “growth-oriented” sectors (like tech, consumer discretionary, semiconductors) against what might be considered “defensive” sectors (like utilities, consumer staples, health care). By analyzing six Exchange Traded Funds (ETFs) (chosen as inputs to the program) we can get an idea of whether the market is currently higher or lower risk. when “growth-oriented” ETFs outperform, it indicates potentially higher risk appetite in the markets. When “defensive” ETFs outperform, it indicates lower risk appetite.
The indicator calculates the relative performance between these two groups on a percentage basis, with a center line at zero. When “growth-oriented” assets outperform, the indicator is positive (above center line). When “defensive” assets outperform, it is negative (below center line).
A value above the center line indicates a risk-seeking (growth) bias, suggesting investor confidence and a preference for cyclical assets. A value below the center line indicates a risk-averse (defensive) tilt, suggesting a more cautious or protective market posture.
The center line serves as a neutral baseline — crossing it can signal a shift in market sentiment.
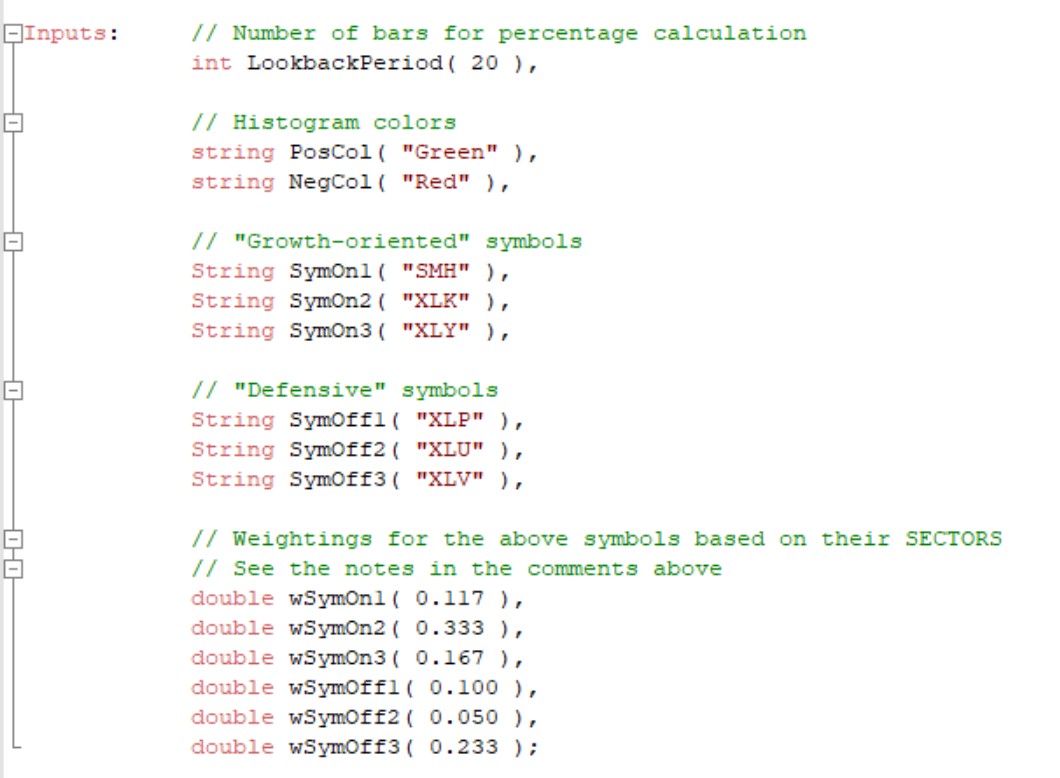
The following symbols are used as default inputs:
“Growth-oriented” sector ETFs
These sectors tend to outperform in periods of economic growth, optimism, or rising risk appetite:
SMH – VanEck Semiconductor ETF
Highly cyclical; semiconductors are a key tech growth industry.
XLK – Technology Select Sector SPDR
Tech stocks thrive in growth environments, and often lead market rallies.
XLY – Consumer Discretionary Select Sector SPDR
Includes companies like Amazon and Tesla, which do well when consumers are confident.
“Defensive” sector ETFs
These sectors tend to outperform or remain stable in periods of economic uncertainty, fear, or flight
to safety:
XLP – Consumer Staples Select Sector SPDR
Includes essentials like food, beverages, and household goods.
XLU – Utilities Select Sector SPDR
Defensive, dividend-paying, and less sensitive to economic cycles.
XLV – Health Care Select Sector SPDR
Typically stable demand regardless of economic conditions.
The user might wish to experiment by using other appropriate ETFs.
Growth-Oriented and Defensive sectors
Percentage-Based Calculation
The indicator computes the relative performance of these ETFs as percentages. It calculates the percentage change of each ETF over a specified period (the current bar and the bar LookbackPeriod bars ago). It then computes a weighted average performance of the “growth-oriented” and “defensive” sector ETFs. Finally it subtracts the defensive sector performance from growth-oriented sector performance to get a net sentiment
measure.
The center line represents a neutral level. If the indicator is above the line, it means growth-oriented sector ETFs are outperforming defensive sector (bullish sentiment). If below the line, it means defensive sector ETFs are outperforming growth oriented sector ETFs (bearish sentiment).
Calculation
GrowthComposite = ( SymOn1_PctChange * wSymOn1 + SymOn2_PctChange * wSymOn2 + SymOn3_PctChange * wSymOn3 ) / 3;
DefensiveComposite = ( SymOff1_PctChange * wSymOff1 + SymOff2_PctChange * wSymOff2 + SymOff3_PctChange * wSymOff3 ) / 3;
where wSymOn1, wSymOn2, wSymOn3, wSymOff1, wSymOff2, and wSymOff3 are market weightings (see below) and
SymOn1_PctChange, SymOn2_PctChange etc are the percentage changes of the ETFs over the LookbackPeriod input
number of bars.
Indicator value = GrowthComposite – DefensiveComposite
Plots
Plot a center line at zero.
Color the plot:
User input PosCol when above zero (Growth).
User input NegCol when below zero (Defensive).
Sector Weighting Notes for “Growth-oriented” / “Defensive” ETF Indicator
This indicator uses a weighted average of percentage changes (ROC) in selected ETFs to represent overall market risk sentiment.
“Growth-oriented” ETFs by default: SMH (Semiconductors), XLK (Technology), XLY (Consumer Discretionary) “Defensive” ETFs by default: XLV (Healthcare), XLP (Consumer Staples), XLU (Utilities)
Normalize Across all ETFs
To reflect true market dynamics, ETF weights should be based on their relative sector capitalization within the total group. Normalizing weights within each group (“Growth” and “Defensive”) would give disproportionate influence to smaller sectors like Utilities (XLU), skewing the indicator.
Instead, all selected ETFs are normalized together so their total weight sums to 1. This ensures each ETF contributes proportionally to its actual size in the market.
An example of how to calculate the weighting
Step 1: Get SECTOR Weights (as % of S&P 500)
These numbers should be updated regularly (for example, quarterly or semiannually), as sector weights do shift over time.
How to find up-to-date weights:
Visit: https://www.ssga.com/us/en/intermediary/etfs/fund-finder
Look for: “Holdings” or “Sector Breakdown” tabs on ETF detail pages
Or use Finviz’s S&P 500 sector map to get quick overviews.
As of recent data (rounded), example sector weights might look like this:
| Sector | ETF | Weight |
|---|---|---|
| Technology | XLK | 27% |
| Consumer Disc. | XLY | 10% |
| Semiconductor | SMH | 7% |
| Health Care | XLV | 14% |
| Consumer Staples | XLP | 6% |
| Utilities | XLU | 3% |
The percentages (e.g., XLK = 27%, XLY = 10%, etc.) were based on the S&P 500 sector weights, not the individual ETF’s total assets under management (AUM).
So for example:
XLK = 27% refers to the Technology sector’s weight in the S&P 500.
It doesn’t mean XLK itself holds 27% of the total ETF market but that it represents that sector, which is 27% of the S&P 500.
These weights are used to approximate how much each sector contributes to the overall market, and thus how much influence each ETF has when representing those sectors.
Step 2: Add Up the Weights for Your Selected ETFs
Six sectors are included here. Add them together:
Total = 20 + 10 + 7 + 14 + 6 + 3 = 60%
Note that the weight for semiconductors is subtracted from the technology weight.
Step 3: Normalize each ETF’s Weight
To get normalized weights (i.e., proportions that add up to 1.0), divide each sector’s weight by the total (60%):
Normalize each ETF’s Weight
| ETF Symbol | Sector | % Weight | Normalized Weight |
|---|---|---|---|
| XLK | Technology | 20% | 20 / 60 = 0.333 |
| XLY | Consumer Disc. | 10% | 10 / 60 = 0.167 |
| SMH | Semiconductors | 7% | 7 / 60 = 0.117 |
| XLV | Healthcare | 14% | 14 / 60 = 0.233 |
| XLP | Consumer Staples | 6% | 6 / 60 = 0.100 |
| XLU | Utilities | 3% | 3 / 60 = 0.050 |
EasyLanguage Notes
A similar program could be developed using multiple data streams, however, this program uses Price Series providers (and hence will not work with MultiCharts).
The program contains two methods. One of the methods is used to create the Price Series Providers and the other to convert names of color objects to be usable in the plot statement.
Sector Tilt (Growth Oriented vs Defensive) Histogram
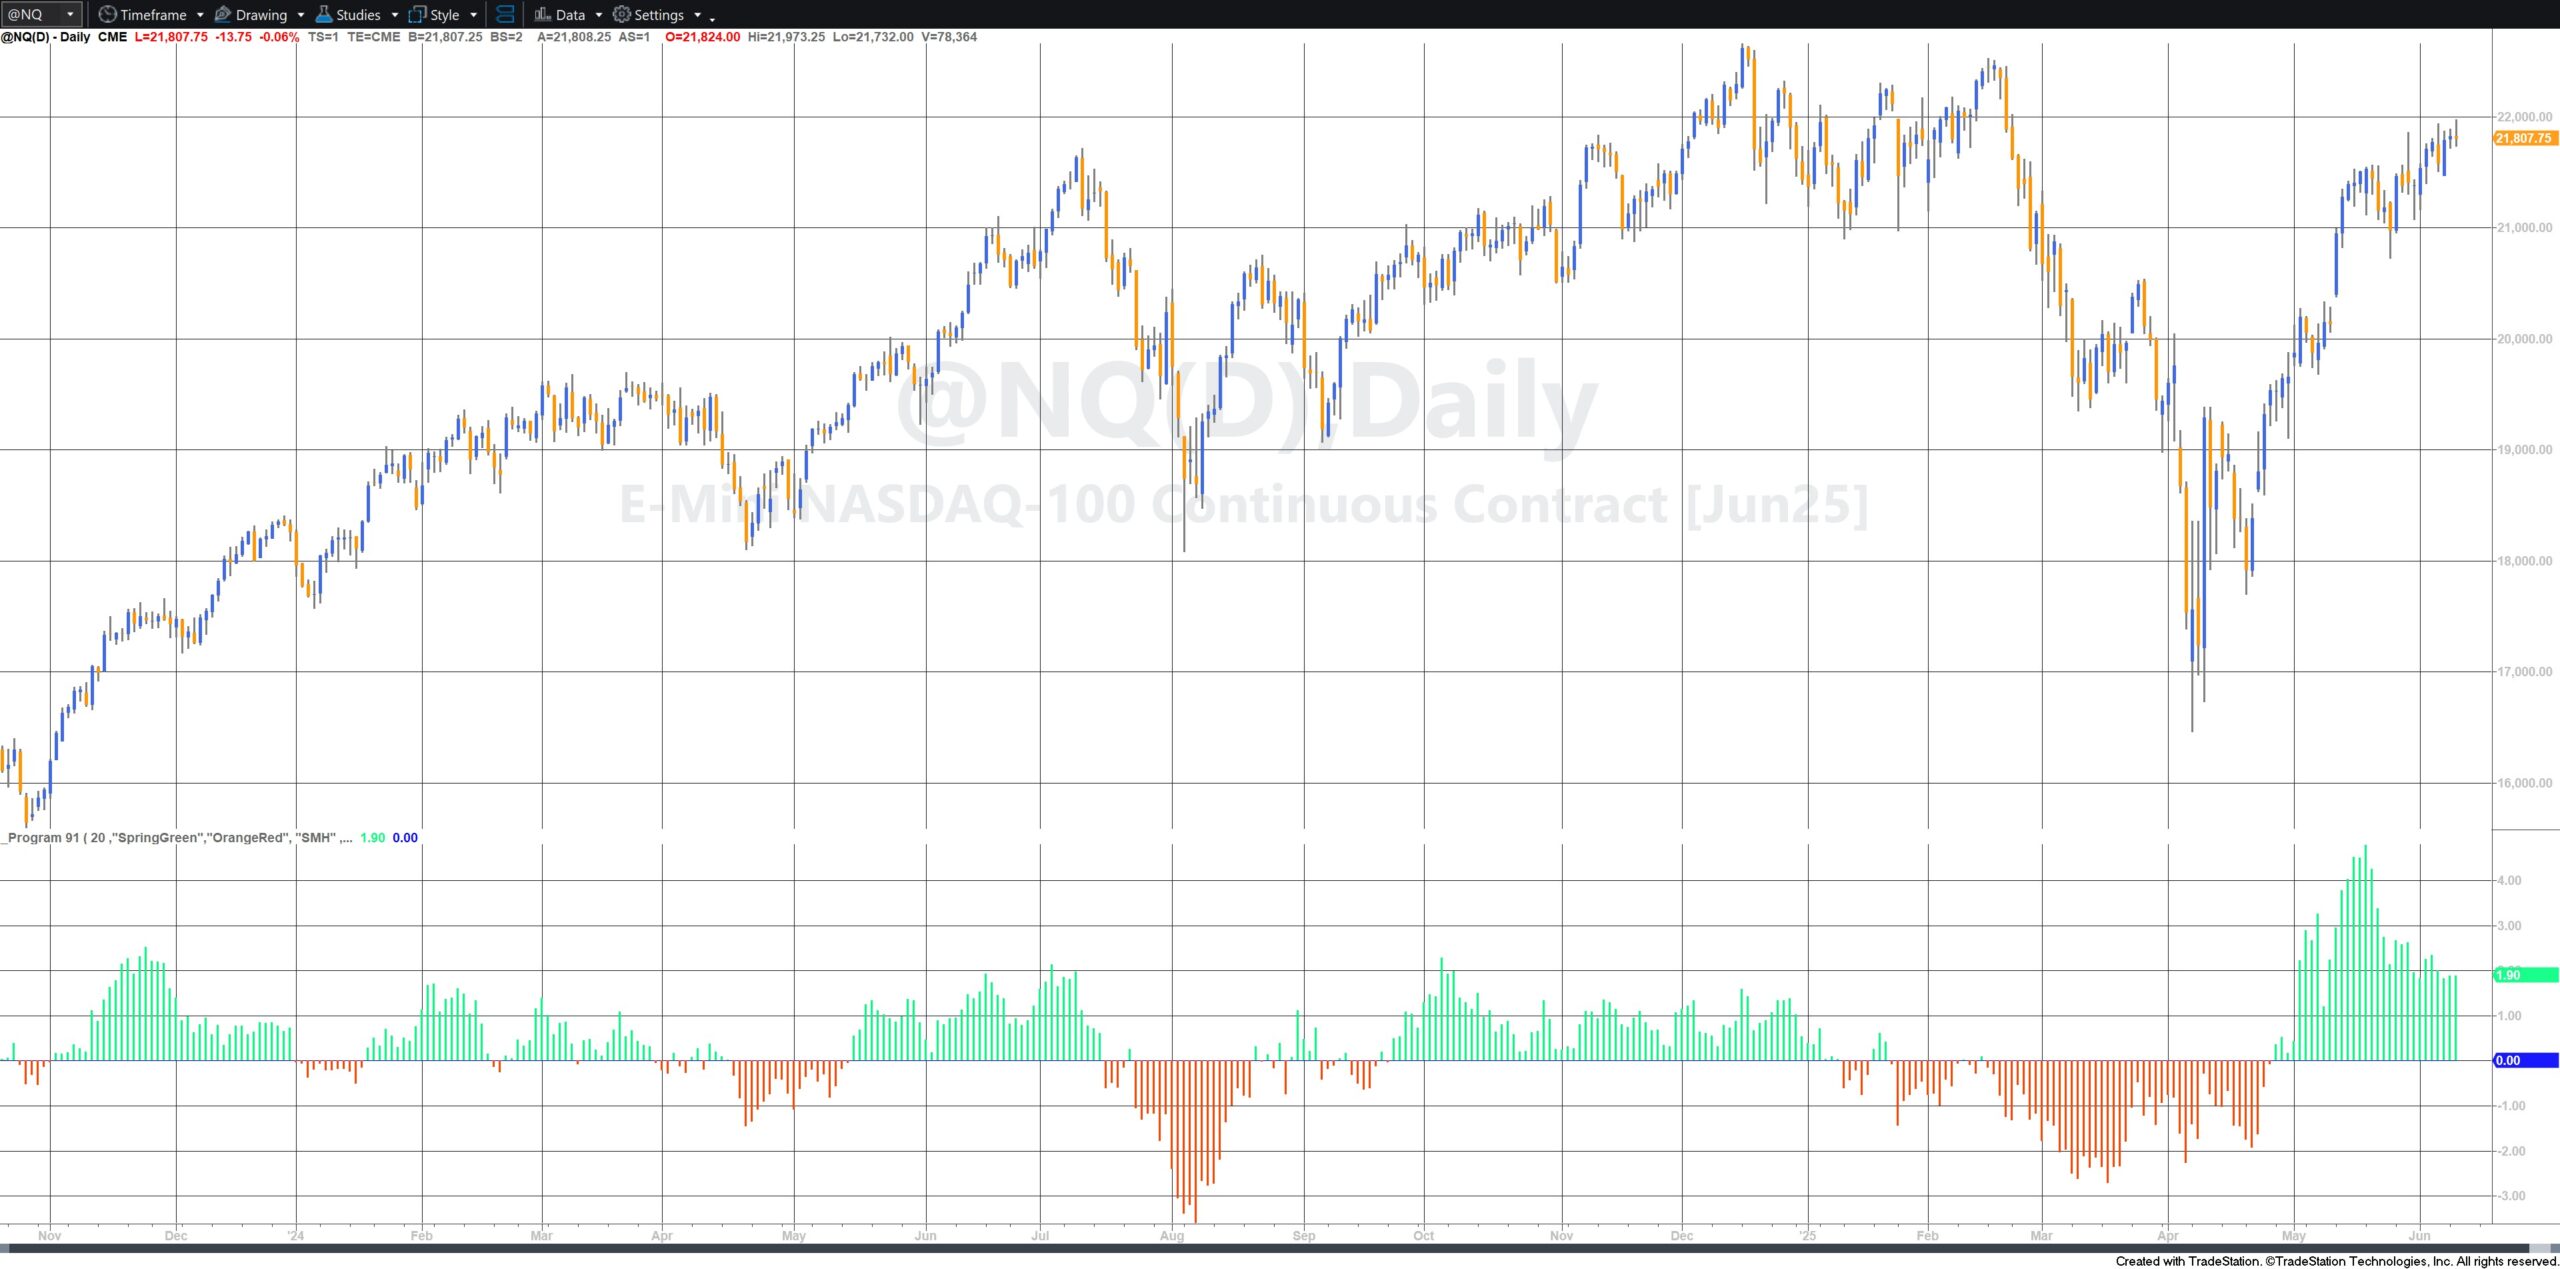
A growth oriented/defensive histogram aims to display the market’s appetite for growth versus safety over time, shown as bars above and below a centerline. Positive values (bars above zero) indicate “growth oriented” periods, while negative values (bars below zero) represent “defensive” periods.
Reading the Histogram
Growth Oriented (Positive Values)
- Markets favor higher-growth assets like stocks, emerging market currencies, and commodities
- Investors are optimistic and willing to chase returns
- Correlations between safe havens (bonds, gold) and growth assets diverge
- Typically coincides with economic growth expectations
Defensive (Negative Values)
- Flight to safety dominates market behavior
- Investors prefer bonds, cash, and defensive assets
- Growth assets like stocks and commodities underperform
- Often triggered by economic uncertainty, geopolitical events, or market stress
Interpretation
Size of bars: Larger bars indicate stronger sentiment in either direction. Small oscillations around zero suggest neutral or mixed sentiment.
Duration patterns: Extended periods in one territory suggest established trends, while rapid alternation may signal market indecision or transition phases.
Divergences: Watch for when the histogram contradicts price action in major indices. If stocks or commodities rally while the histogram shows increasing defensive sentiment, it may signal underlying weakness.
Extreme readings: Very high positive or negative values often mark sentiment extremes and potential reversal points, as markets rarely sustain extreme positioning indefinitely.
Optimal Timeframes and Bar Lengths
Daily Timeframe (Recommended Primary)
Daily bars are typically the most effective for growth oriented/defensive indicators because:
- Market sentiment shifts develop over days rather than hours
- They filter out intraday noise that can create false signals
Multi-Timeframe Approach
The most robust implementation uses multiple timeframes:
Weekly Bars: For major trend identification and long-term portfolio allocation decisions. Weekly data smooths out short-term volatility and reveals persistent market regime changes.
Daily Bars: For tactical trading decisions and timing entries/exits within the broader weekly trend.
4-Hour Bars: Can be useful for active traders to catch early shifts in sentiment, but should be used in conjunction with daily readings to avoid false signals.
Why Shorter Timeframes Are Less Effective
Hourly or shorter timeframes tend to be counterproductive because:
- Market sentiment changes are fundamentally macro-economic phenomena
- Intraday price movements often reflect technical factors rather than genuine appetite shifts
- Creates excessive signal noise that can lead to overtrading
Trading Applications
Program 91 could potentially be used as part of a technical analysis to gauge the overall market, time entries and exits, and assess whether current market moves align with underlying market sentiment. It’s particularly valuable for portfolio allocation decisions and understanding the broader market context for individual trades.
Practical Recommendation
Start with daily bars as your primary timeframe, then reference weekly for context and 4-hour for timing refinement. Most professional growth oriented/defensive indicators default to daily calculations because this timeframe best captures the underlying market psychology driving these sentiment shifts.
The key is matching the indicator’s timeframe to the speed at which market sentiment actually changes. This is typically measured in days, not hours or minutes.
Download program 91
The tutorial is NOT compatible with MultiCharts.
The program has been thoroughly tested, however, please report any software bugs.
Available Colors
| AliceBlue | DarkSlateGray | LightSalmon | PaleVioletRed |
| AntiqueWhite | DarkTurquoise | LightSeaGreen | PapayaWhip |
| Aqua | DarkViolet | LightSkyBlue | PeachPuff |
| Aquamarine | DeepPink | LightSlateGray | Peru |
| Azure | DeepSkyBlue | LightSteelBlue | Pink |
| Beige | DimGray | LightYellow | Plum |
| Bisque | DodgerBlue | Lime | PowderBlue |
| Black | Firebrick | LimeGreen | Purple |
| BlanchedAlmond | FloralWhite | Linen | Red |
| Blue | ForestGreen | Magenta | RosyBrown |
| BlueViolet | Fuschia | Maroon | RoyalBlue |
| Brown | Gainsboro | MediumAquamarine | SaddleBrown |
| Burlywood | GhostWhite | MediumBlue | Salmon |
| CadetBlue | Gold | MediumOrchid | SandyBrown |
| Chartreuse | Goldenrod | MediumPurple | SeaGreen |
| Chocolate | Gray | MediumSeaGreen | Seashell |
| Coral | Green | MediumSlateBlue | Sienna |
| CornflowerBlue | GreenYellow | MediumSpringGreen | Silver |
| Cornsilk | Honeydew | MediumTurquoise | SkyBlue |
| Cyan | HotPink | MediumVioletRed | SlateBlue |
| DarkBlue | IndianRed | MidnightBlue | SlateGray |
| DarkBrown | Indigo | MintCream | Snow |
| DarkCyan | Ivory | MistyRose | SpringGreen |
| DarkGoldenrod | Khaki | Moccasin | SteelBlue |
| DarkGray | Lavender | NavajoWhite | Tan |
| DarkGreen | LavenderBlush | Navy | Teal |
| DarkKhaki | LawnGreen | OldLace | Thistle |
| Dark Magenta | LemonChiffon | Olive | Tomato |
| DarkOliveGreen | LightBlue | OliveDrab | Turquoise |
| DarkOrange | LightCoral | Orange | Violet |
| DarkOrchid | LightCyan | OrangeRed | Wheat |
| DarkRed | LightGoldenrodYellow | Orchid | White |
| DarkSalmon | LightGray | PaleGoldenrod | WhiteSmoke |
| DarkSeaGreen | LightGreen | PaleGreen | Yellow |
| DarkSlateBlue | LightPink | PaleTurquoise | YellowGreen |
TO THE BEST OF MARKPLEX CORPORATION’S KNOWLEDGE, ALL OF THE INFORMATION ON THIS PAGE IS CORRECT, AND IT IS PROVIDED IN THE HOPE THAT IT WILL BE USEFUL. HOWEVER, MARKPLEX CORPORATION ASSUMES NO LIABILITY FOR ANY DAMAGES, DIRECT OR OTHERWISE, RESULTING FROM THE USE OF THIS INFORMATION AND/OR PROGRAM(S) DESCRIBED, AND NO WARRANTY IS MADE REGARDING ITS ACCURACY OR COMPLETENESS. USE OF THIS INFORMATION AND/OR PROGRAMS DESCRIBED IS AT YOUR OWN RISK.
ANY EASYLANGUAGE OR POWERLANGUAGE TRADING STRATEGIES, SIGNALS, STUDIES, INDICATORS, SHOWME STUDIES, PAINTBAR STUDIES, PROBABILITYMAP STUDIES, ACTIVITYBAR STUDIES, FUNCTIONS (AND PARTS THEREOF) AND ASSOCIATED TECHNIQUES REFERRED TO, INCLUDED IN OR ATTACHED TO THIS TUTORIAL OR PROGRAM DESCRIPTION ARE EXAMPLES ONLY, AND HAVE BEEN INCLUDED SOLELY FOR EDUCATIONAL PURPOSES. MARKPLEX CORPORATION. DOES NOT RECOMMEND THAT YOU USE ANY SUCH TRADING STRATEGIES, SIGNALS, STUDIES, INDICATORS, SHOWME STUDIES, PAINTBAR STUDIES, PROBABILITYMAP STUDIES, ACTIVITYBAR STUDIES, FUNCTIONS (OR ANY PARTS THEREOF) OR TECHNIQUES. THE USE OF ANY SUCH TRADING STRATEGIES, SIGNALS, STUDIES, INDICATORS, SHOWME STUDIES, PAINTBAR STUDIES, PROBABILITYMAP STUDIES, ACTIVITYBAR STUDIES, FUNCTIONS AND TECHNIQUES DOES NOT GUARANTEE THAT YOU WILL MAKE PROFITS, INCREASE PROFITS, OR MINIMIZE LOSSES.

