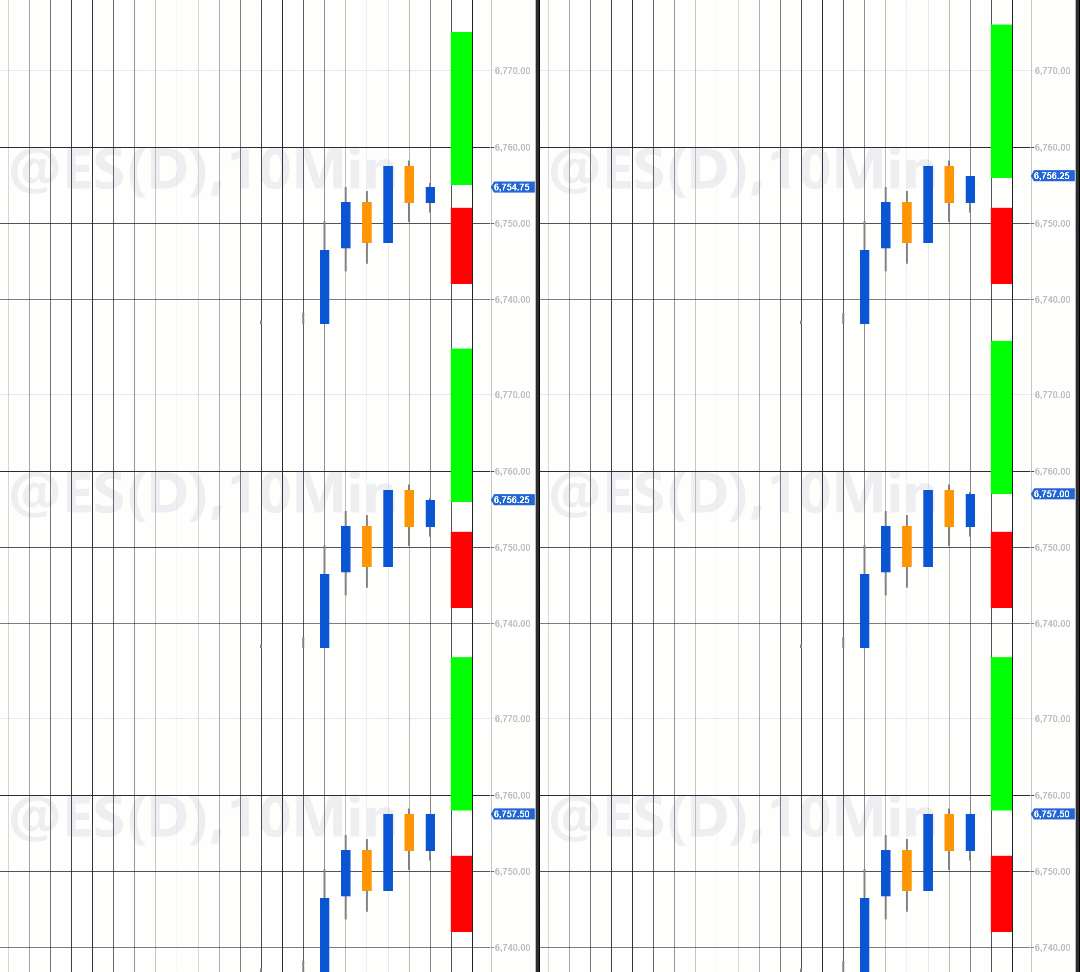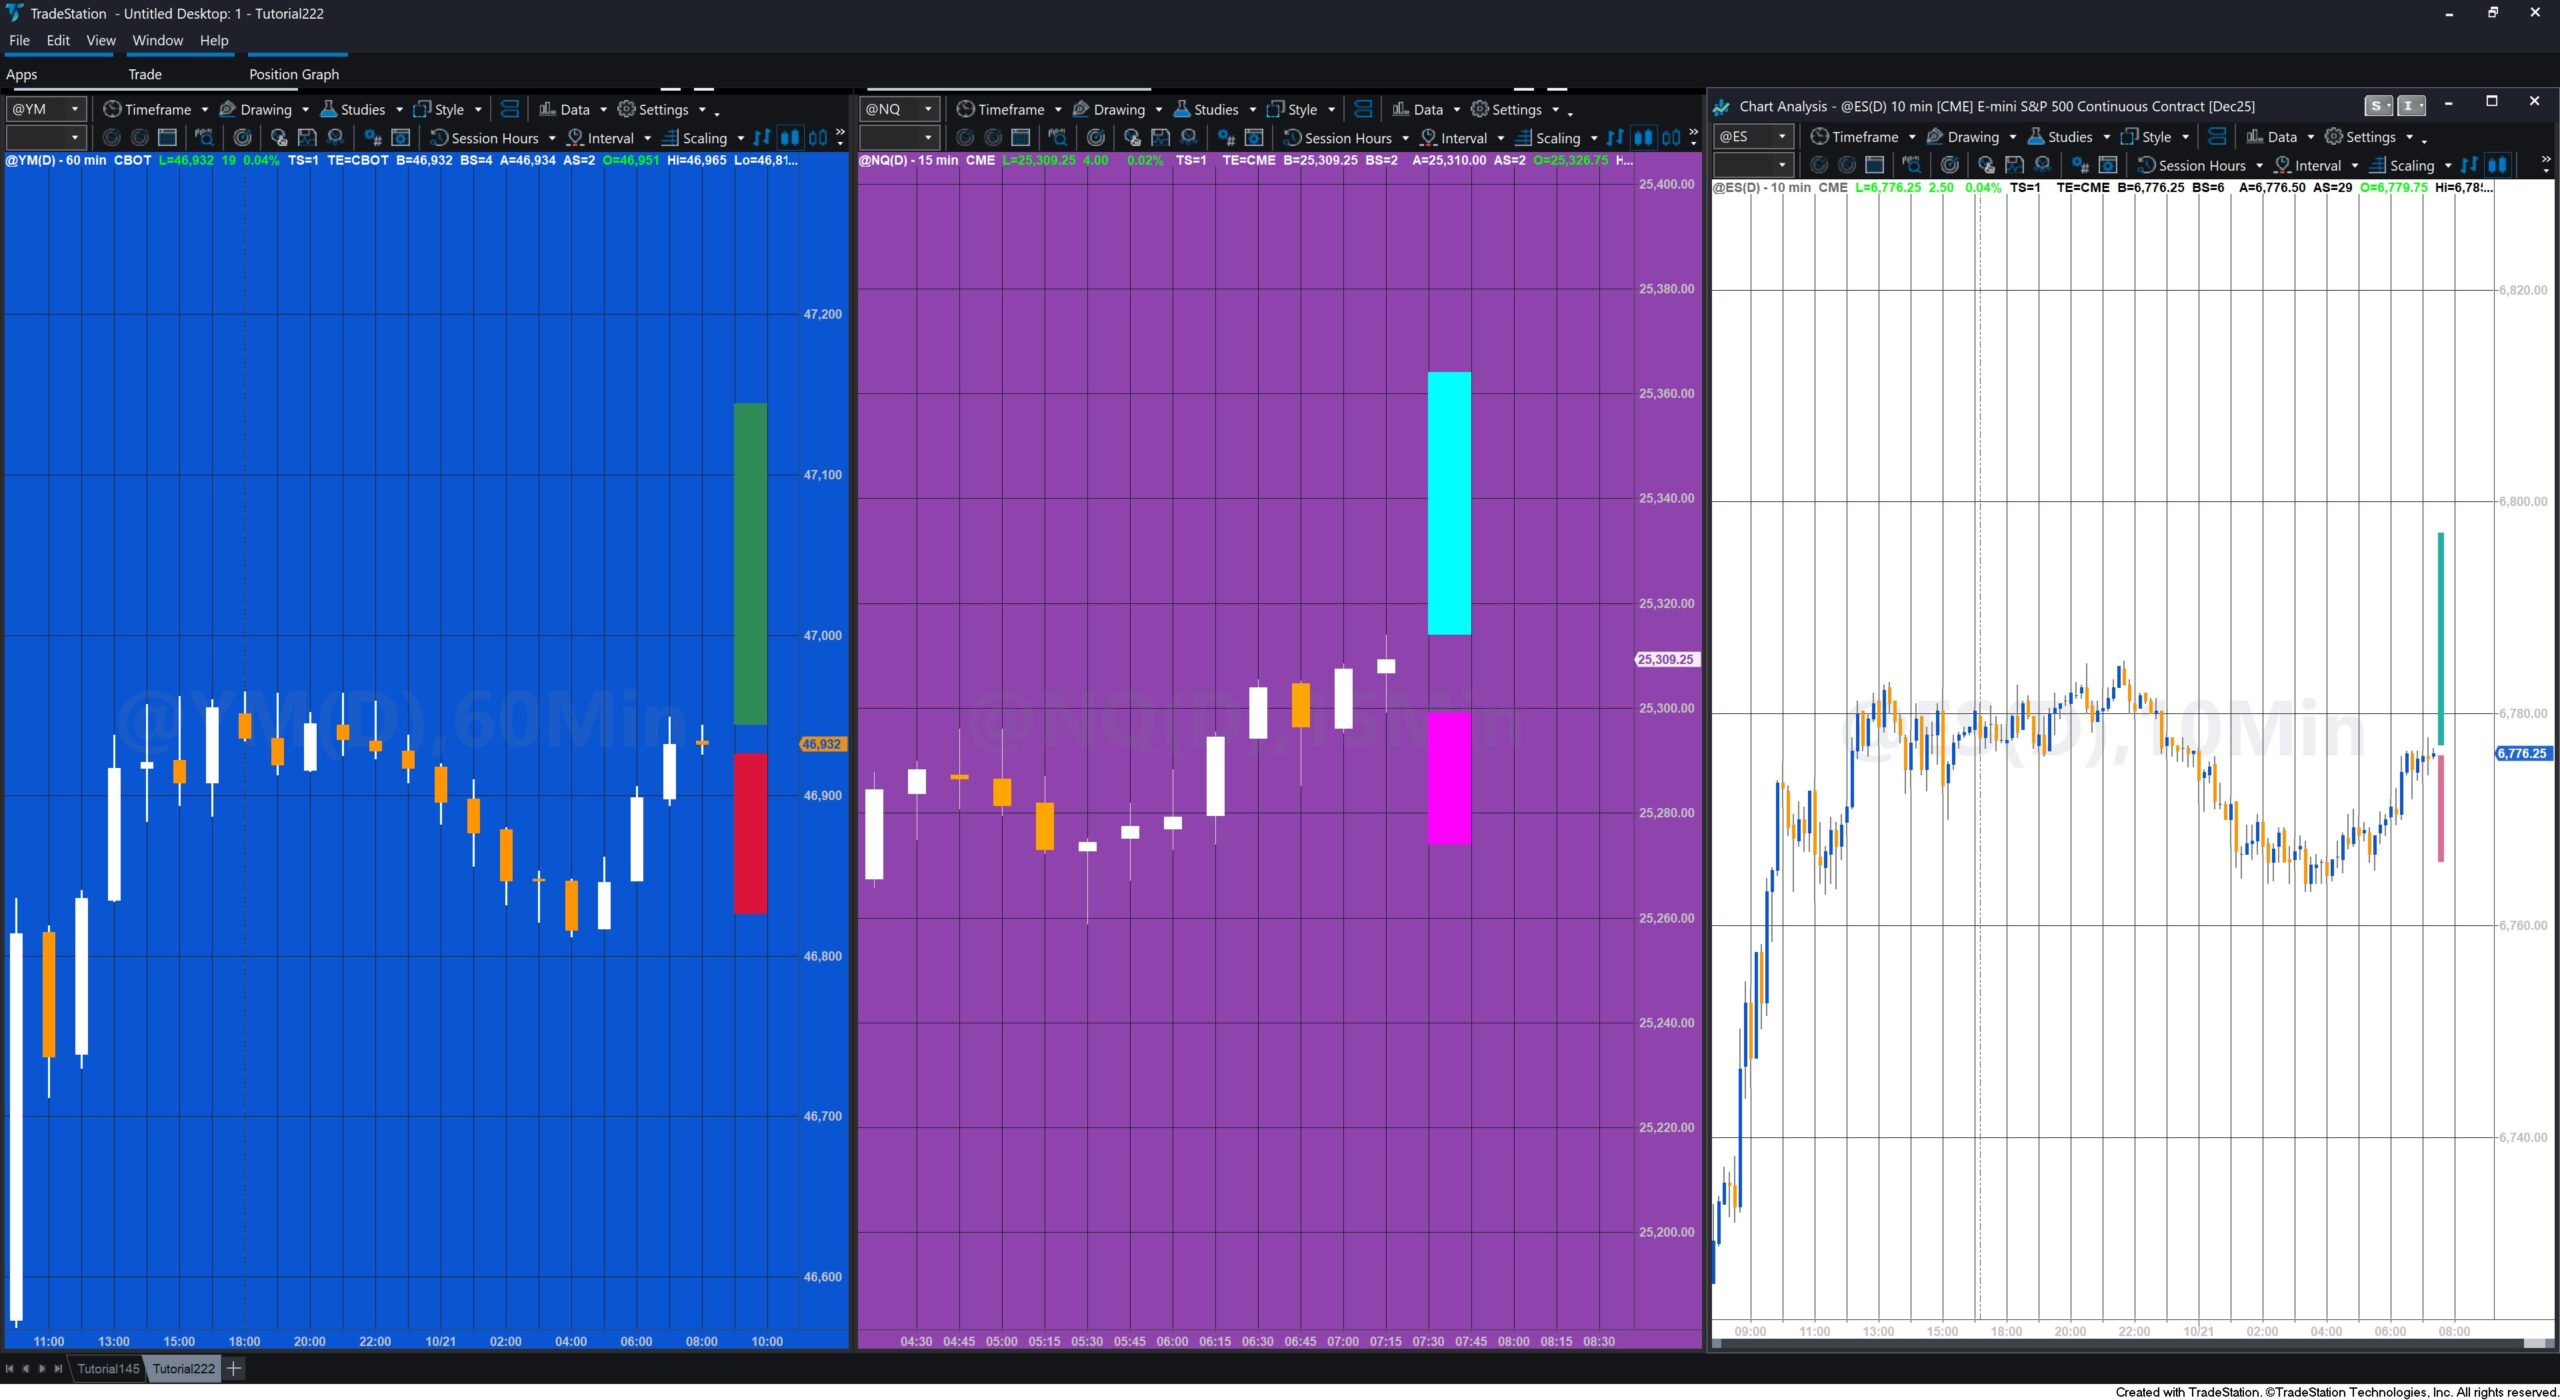
A Gold Pass member requested a set of tutorials and programs to create a “Big Point Ruler” on a chart—a visual tool showing how far the price would need to move to reach a target profit, such as $1,000, based on one contract (or any user-specified dollar amount and number of contracts). Some example point values are shown below.
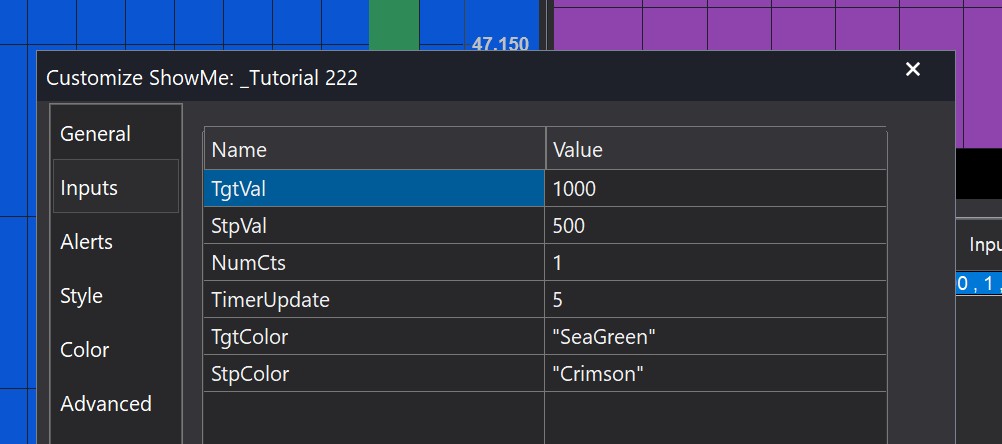
Tutorial 222, based on tutorial 221 demonstrates how to draw and position two rectangles. One of the rectangles show how many points the symbol needs to move to reach a user input target. The other rectangle shows the number of points that a symbol would need to decrease to hit a stop. The tutorial assumes a long position.
Unlike tutorial 221 the rectangles are not positioned at the center for the chart, rather the target rectangle is positioned from the high of the last bar on the chart, and the stop bar is positioned from the low of the last bar.
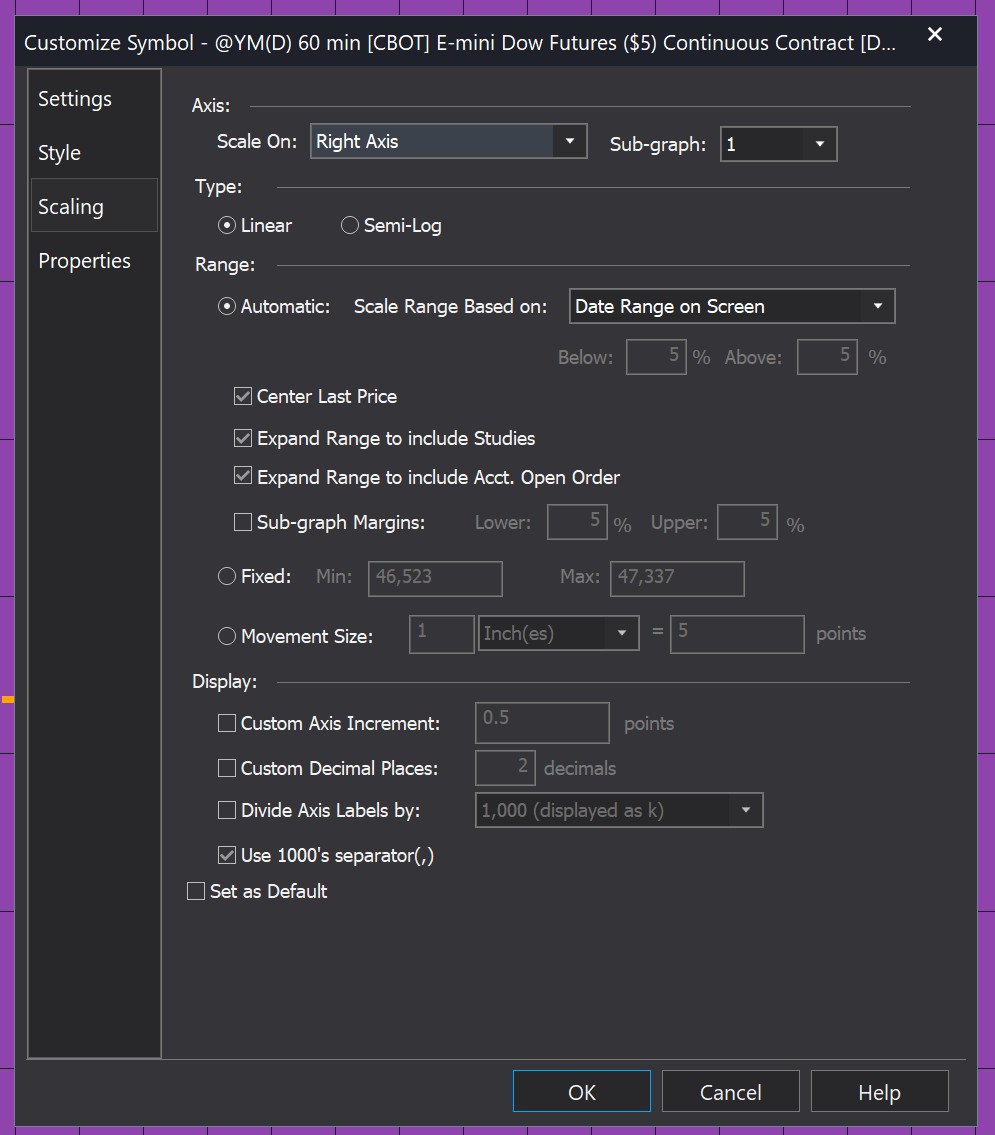
I have also checked the “center last price” in the data settings for the screen shots and the video on the tutorial page at markplex.com.
Like tutorial 221, the Charting Host object is used to detect if the chart is resized and the timer is used to refresh the chart every few seconds.
The basic syntax for the objects used in the program (i.e. the rectangle, timer, charting host) can be found by clicking on the object in the toolbox, selecting the object in the tool tray and then examining and copying the code from the designer generator code. Once the code is copied and pasted into the main program the object must be deleted from the tool tray. This is demonstrated in the tutorial.
Much of the syntax is the same as that in tutorial 221 however the method that draws a rectangle (DrawRectangle) has been changed to allow the input of an existing rectangle, to return a rectangle and to make color one of the inputs.
A new method has been created to call the DrawRectangle method for the two rectangles being drawn or modified.
The timer method has been modified to allow a user input (TimerUpdate) to set the interval.
Point values
| Symbol | Contract | Multiplier | Tick size | Tick value | $ per 1 point move |
|---|---|---|---|---|---|
| @ES | E-mini S&P 500 | $50 × index | 0.25 points | $12.50 | $50 |
| @NQ | E-mini Nasdaq-100 | $20 × index | 0.25 points | $5 | $20 |
| @YM | E-mini Dow Jones | $5 × index | 1 point | $5 | $5 |
On the @ES (E-mini S&P 500), a $1,000 move requires 20 points ($1,000 ÷ $50 = 20). The Big Point Ruler on an ES chart would therefore span 20 points.
On the @NQ (E-mini Nasdaq-100), it would take 50 points ($1,000 ÷ $20 = 50), so the ruler would be 50 points long.
and on the @YM (E-mini Dow Jones), it would take 200 points ($1,000 ÷ $5 = 200), so the ruler would be 200 points long.

A “Trader’s Ruler” (also called a “Big Point Ruler”) is a visual measuring tool that helps traders quickly see how much a symbol’s price must move to achieve a specific dollar gain or loss. Instead of doing mental math or using a calculator to determine how far the market needs to travel for, say, a $1,000 profit, the ruler draws this information directly on the chart.
This “Trader’s Ruler” serves as an intuitive guide for visualizing trade potential and risk. It allows traders to quickly assess whether a given price move is realistic based on recent volatility or chart structure.


Explanation of tutorial 222
Download the tutorial 222 tutorial
If you wish to save yourself some typing, the tutorial programs are available for immediate download by clicking the ‘add to cart’ button below. You may pay using PayPal or a credit card. The price is $14.95
Free download for Gold Pass members
Download the tutorial 222 TradeStation EasyLanguage example show me study free for Gold Pass members. If you are a Gold Pass member you can download the tutorial code below, please make sure that you are logged in with your Gold Pass user name and password. ![]() This content is for members only.
This content is for members only.
Colors
| AliceBlue | DarkSlateGray | LightSalmon | PaleVioletRed |
| AntiqueWhite | DarkTurquoise | LightSeaGreen | PapayaWhip |
| Aqua | DarkViolet | LightSkyBlue | PeachPuff |
| Aquamarine | DeepPink | LightSlateGray | Peru |
| Azure | DeepSkyBlue | LightSteelBlue | Pink |
| Beige | DimGray | LightYellow | Plum |
| Bisque | DodgerBlue | Lime | PowderBlue |
| Black | Firebrick | LimeGreen | Purple |
| BlanchedAlmond | FloralWhite | Linen | Red |
| Blue | ForestGreen | Magenta | RosyBrown |
| BlueViolet | Fuschia | Maroon | RoyalBlue |
| Brown | Gainsboro | MediumAquamarine | SaddleBrown |
| Burlywood | GhostWhite | MediumBlue | Salmon |
| CadetBlue | Gold | MediumOrchid | SandyBrown |
| Chartreuse | Goldenrod | MediumPurple | SeaGreen |
| Chocolate | Gray | MediumSeaGreen | Seashell |
| Coral | Green | MediumSlateBlue | Sienna |
| CornflowerBlue | GreenYellow | MediumSpringGreen | Silver |
| Cornsilk | Honeydew | MediumTurquoise | SkyBlue |
| Cyan | HotPink | MediumVioletRed | SlateBlue |
| DarkBlue | IndianRed | MidnightBlue | SlateGray |
| DarkBrown | Indigo | MintCream | Snow |
| DarkCyan | Ivory | MistyRose | SpringGreen |
| DarkGoldenrod | Khaki | Moccasin | SteelBlue |
| DarkGray | Lavender | NavajoWhite | Tan |
| DarkGreen | LavenderBlush | Navy | Teal |
| DarkKhaki | LawnGreen | OldLace | Thistle |
| Dark Magenta | LemonChiffon | Olive | Tomato |
| DarkOliveGreen | LightBlue | OliveDrab | Turquoise |
| DarkOrange | LightCoral | Orange | Violet |
| DarkOrchid | LightCyan | OrangeRed | Wheat |
| DarkRed | LightGoldenrodYellow | Orchid | White |
| DarkSalmon | LightGray | PaleGoldenrod | WhiteSmoke |
| DarkSeaGreen | LightGreen | PaleGreen | Yellow |
| DarkSlateBlue | LightPink | PaleTurquoise | YellowGreen |
TO THE BEST OF MARKPLEX CORPORATION’S KNOWLEDGE, ALL OF THE INFORMATION ON THIS PAGE IS CORRECT, AND IT IS PROVIDED IN THE HOPE THAT IT WILL BE USEFUL. HOWEVER, MARKPLEX CORPORATION ASSUMES NO LIABILITY FOR ANY DAMAGES, DIRECT OR OTHERWISE, RESULTING FROM THE USE OF THIS INFORMATION AND/OR PROGRAM(S) DESCRIBED, AND NO WARRANTY IS MADE REGARDING ITS ACCURACY OR COMPLETENESS. USE OF THIS INFORMATION AND/OR PROGRAMS DESCRIBED IS AT YOUR OWN RISK.
ANY EASYLANGUAGE OR POWERLANGUAGE TRADING STRATEGIES, SIGNALS, STUDIES, INDICATORS, SHOWME STUDIES, PAINTBAR STUDIES, PROBABILITYMAP STUDIES, ACTIVITYBAR STUDIES, FUNCTIONS (AND PARTS THEREOF) AND ASSOCIATED TECHNIQUES REFERRED TO, INCLUDED IN OR ATTACHED TO THIS TUTORIAL OR PROGRAM DESCRIPTION ARE EXAMPLES ONLY, AND HAVE BEEN INCLUDED SOLELY FOR EDUCATIONAL PURPOSES. MARKPLEX CORPORATION. DOES NOT RECOMMEND THAT YOU USE ANY SUCH TRADING STRATEGIES, SIGNALS, STUDIES, INDICATORS, SHOWME STUDIES, PAINTBAR STUDIES, PROBABILITYMAP STUDIES, ACTIVITYBAR STUDIES, FUNCTIONS (OR ANY PARTS THEREOF) OR TECHNIQUES. THE USE OF ANY SUCH TRADING STRATEGIES, SIGNALS, STUDIES, INDICATORS, SHOWME STUDIES, PAINTBAR STUDIES, PROBABILITYMAP STUDIES, ACTIVITYBAR STUDIES, FUNCTIONS AND TECHNIQUES DOES NOT GUARANTEE THAT YOU WILL MAKE PROFITS, INCREASE PROFITS, OR MINIMIZE LOSSES.

