
A Gold Pass member asked the following question:
Could you modify Tutorial 224 to calculate the open of the day, to draw a line at this level and to draw the text for this level in the price axis?
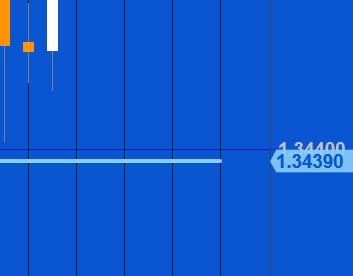
The answer is that you cannot draw text in the price axis column. A far simpler approach to this is to plot the value instead of drawing it. In addition, by using an Indicator (the original tutorial 224 was a show me study) the value plotted is included in the price axis.
Free download for Gold Pass members
Download Q&A 60. Download the tutorial code below as an ELD file