Welcome to tutorial 13 in this series of tutorials designed to explain TradeStation EasyLanguage concepts. If you learn the TradeStation EasyLanguage yourself, you will have a skill that will enable you to try out trading ideas without being so reliant on others. In tutorial 12, we created a basic RadarScreen indicator. The tutorial was designed to help you with the ‘mechanics’ of creating your own indicator for RadarScreen.
This indicator is designed to create lines of support or resistance based on previous pivot points. As always, bear in mind that the program is designed to demonstrate programming techniques (i.e. pivot points, arrays etc) rather than necessarily being useful, ‘out of the box.’ Please try understanding and varying the settings before concluding that the program is not working.
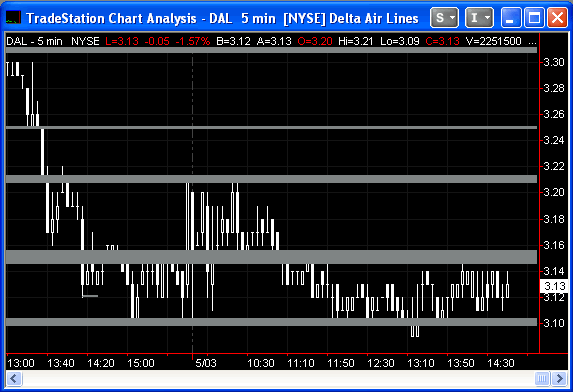
In the tutorial, we create a multidimensional array to keep track of the pivots. If a pivot level is within a predefined tolerance of a previous pivot level that we have found then we will increase the thickness of pivot line of the original pivot line. If the line exceeds a certain thickness we will extend the line to the right so that we can see what its relationship is (if any) to future price action. This sounds complicated but what we are attempting to achieve is something similar to the following:
Step 1
To avoid typing the indicator, you may download an ELD for only $29.95 by clicking the following button:
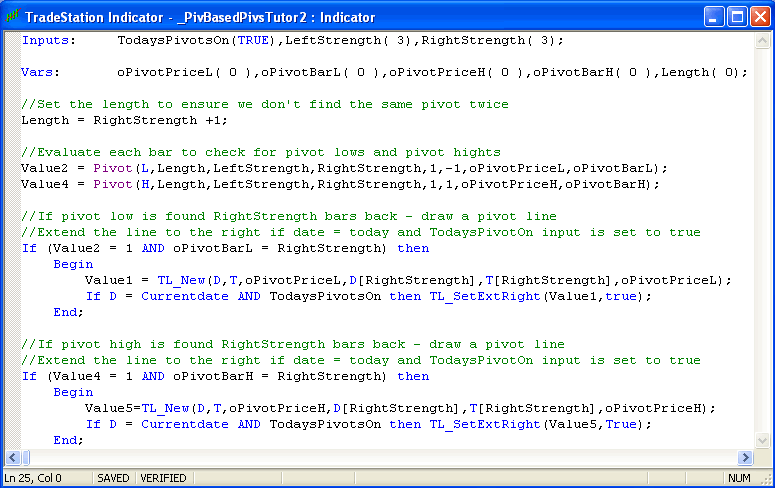
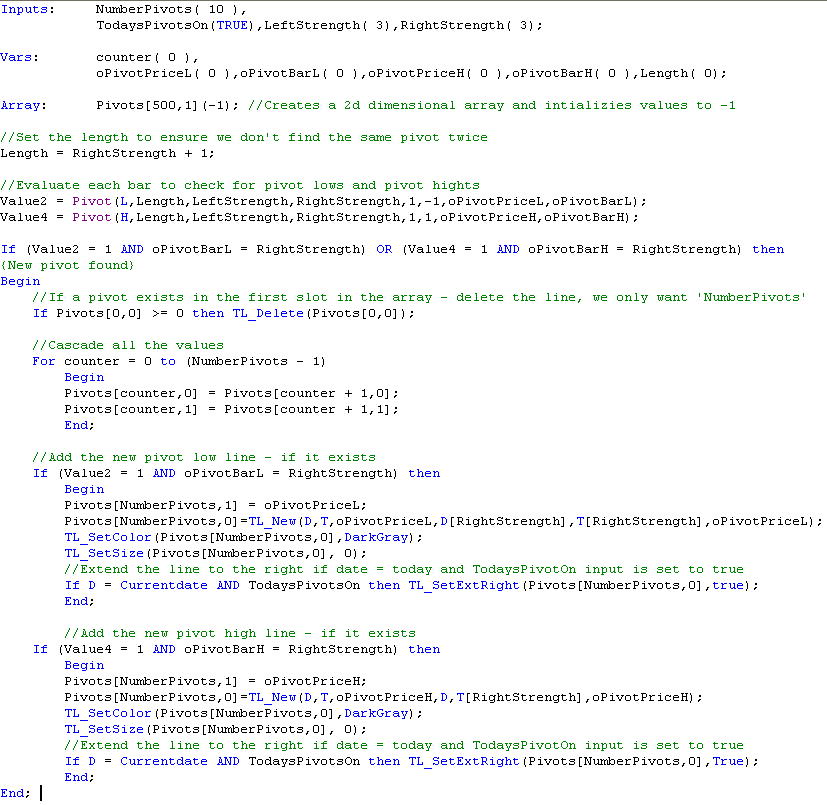
Open TradeStation and create a new indicator by clicking File – New – Window. Select the EasyLanguage tab and select Indicator. Give the new indicator a name and enter the following program. If you are unsure as to how to enter and validate an EasyLanguage program, please review one of the earlier tutorials in this series. Notice that I have added several comments in the program (colored green). These comments don’t have an effect on the functioning of the program but may be helpful to you in understanding what the program does. Creating comments is also good programming practice. The way you create a program today may be blindingly obvious – it might not seem quite so clear in a year’s time when you wish to modify the program. A comment now could save you serious time in the future.
Step 2
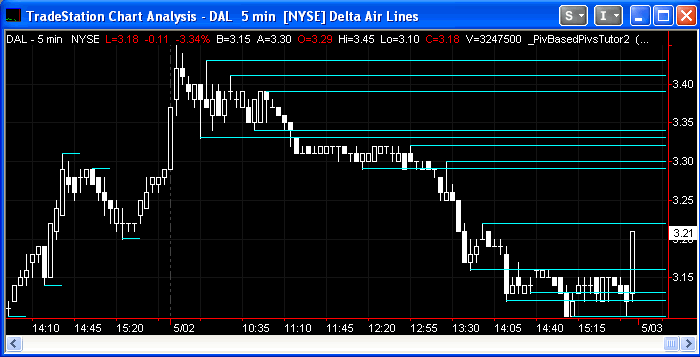
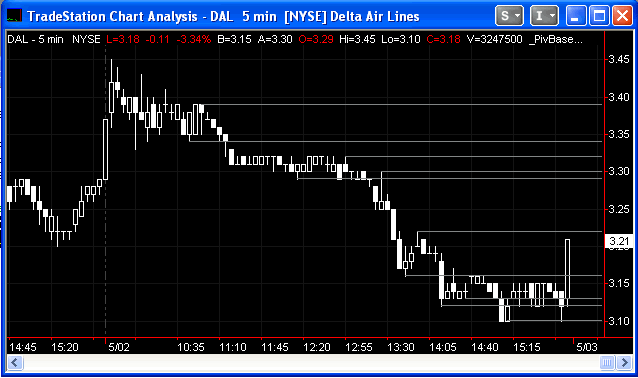
When you have entered the program – validate it and apply to a chart. I applied it to a 5 min DAL chart (see below). The program simply evaluates each bar, if the bar is a high or low pivot it draws a line at the pivot level. I included an input named TodaysPivotOn. If this is set to TRUE, today’s pivots are extended to the right.
This is not a terrifically useful program so far, however it demonstrates how to find pivots and draw pivot lines on charts. It does not contain any mechanism for deleting lines.
Step 3
The next step in the process is to make it so that we can specify the number of pivots that will appear on the chart. To achieve this, we will use an array named Pivots. To ‘declare’ the array we need a statement somewhat similar to the ones we use to tell the program about our inputs and variables. If you are unfamiliar with arrays, review Tutorial 7 in this series. The array in this tutorial is similar to the one that I introduced in tutorial 7 – the major difference is that this is a 2 dimensional array, in other words, we can store two values on every ‘row’ rather than one.
Array: Pivots[500,1](-1);
tells the program to create an array with 501 rows (we begin counting at zero) and 2 columns. Every element in the array is initialized to -1.
When storing pivot details in the Pivots array we will store the pivot line ID in the first ‘cell’ and the pivot value in the second., For example For the tenth row in the array (remember we count from zero), the ID is stored in Pivots[9,0] and the pivot value is stored in Pivots[9,1].
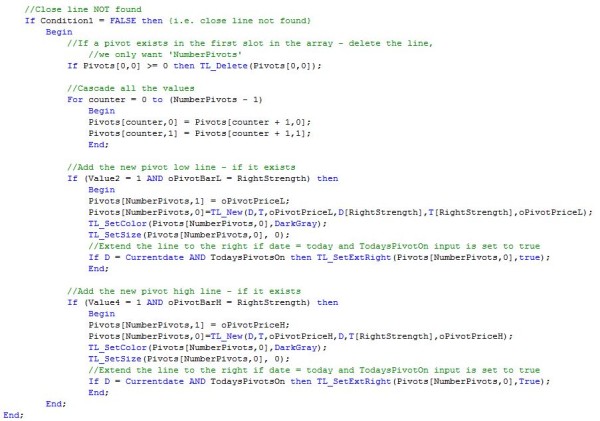
In broad terms the following program works as follows: each bar is evaluated, if it is found to be a pivot then we delete the pivot that is currently stored in Pivots[0,0]. This is achieved using the TL_Delete(Pivots[0,0] command. This will remove the pivot line drawing object from the chart. We then cascade the values in our array to leave space in the Pivots[NumberPivots,0] and Pivots[NumberPivots,1] cells for the new pivot that we have just discovered. After the cascading is complete we store the new pivot information into Pivots[NumberPivots,0] and Pivots[NumberPivots,1].
Step 4
Validate the program and apply to a chart. The result should look something like the following – not too different from the previous example, except that we have limited the number of pivots on the chart.
Step 5
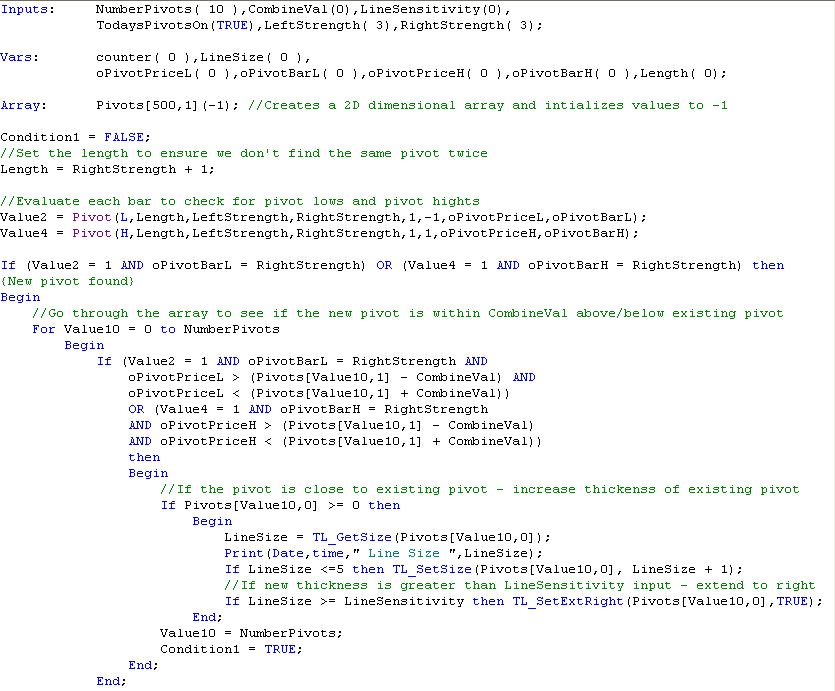
Now things get more interesting. The following program uses the techniques we have looked at so far. In summary the following program examines each bar to see if a pivot has occurred. If a pivot has occurred. the program evaluates the new pivot level against the pivots levels already stored in the Pivots array. If the new pivot is within CombineVal (we set this as an input) above or below the pivot stored in the array, then the program increases the thickness of the existing pivot line stored in the array. If the thickness of this pivot is greater than the user defined input: LineSensitivity, the line is extended to the right. After having found a match, we do not want to continue going through the loop and so we set the counter: Value10, to be equal to the number of pivots. This completes the loop. We also set Condition1 to be TRUE. More about this in a few moments.
If, having gone through the array, it turns out that none of the existing pivots stored in the array are close to the new pivot, we delete the oldest pivot and add the new one. Notice how this part of the program only runs if Condition1 is FALSE. This is because we don’t want to add the new pivot if we have already increased the thickness of a pre-existing pivot line. This part of the program works in a way that is very similar to the previous section of this tutorial.
Step 6
Enter the program, validate it and apply to a chart. The result should look something like the following. You will likely want to adjust the CombineValue and LineSensitivity.
Note that the size of the array is 501. In theory this means that the maximum number of pivots that you can show is 500, but bear in mind that the program loops through the array every time a pivot is found – this is a lot of processing and could slow your TradeStation session down.

If you see any errors in this tutorial – or I have not made something clear, please e-mail: tutorials@markplex.com.
To avoid typing the indicator, you may download an ELD for only $29.95 by clicking the following button:
Summary
This tutorial demonstrates the creation of an indicator using various techniques, including a multi dimensional array.
If you have any questions about the above material or you would like to point out a correction or typo, please e-mail: tutorials@markplex.com. Also e-mail if you have any ideas for future tutorials.
P.S. I have been asked by some clients to explain how CombineVal and LineSensitivity work. CombineVal works as follows:
Every time a new pivot line is found the program goes though all the pivot lines that are currently stored in an array. An array is a data structure that stores multiple values. If the program finds a new pivot line and the new line is within a band that is bounded by an existing pivot stored in the array plus or minus the CombineVal then the program increases the thickness of the line stored in the array (provided the existing thickness of the line is 3 or less). If a new pivot is NOT within the CombineVal tolerance of a line already in the array then the program deletes the oldest pivot line in the array and stores the new line.
Therefore by increasing the CombineVal input means that more new pivots that the program finds with be within tolerance of existing pivots lines and they will be combined and become thicker. Hence a really small value of CombineVal would mean that virtually no lines would ever combine. If you were to apply the program to a GBPUSD chart and set the CombineVal to 0.0001 then you would see very few lines being combined because for them to combine they would have to be within 0.0001. A very large CombineVal would mean that lots of lines would combine (and they may even have combined off the screen where you cannot see them).
As an example, let’s assume we are looking at the GBPUSD. Say we have a pivot stored in the array at a value of 1.44034, and lets assume our CombineVal input is 0.0001, then the program will look for new pivots between 1.44034 + 0.0001 and 1.44034 – 0.0001 (i.e. between 1.44044 and 1.44024). if it find one it combines it with the existing pivot – if not it creates a new pivot.
In terms of thickness, EasyLanguage uses a programming construct (TL_SetSize) that can set line thickness at either 0 (very thin), 1 (thin), 2, 3, 4, 5 or 6 (very thick).
The LineSensitivity input setting determines when a line is extended to the right. Possible values are 0, 1, 2, 3 or 4. As I explained above, CombineVal determines whether the thickness of existing pivot lines is increased when a new pivot line is within CombineVal tolerance of the existing pivot line. If LineSensitivity is set to 4 then only lines with a thickness of 4 are extended to the right. If it is set to 0 then all lines that are combined are extended to the right.
Video explanation part 1 – the Pivot function
TO THE BEST OF MARKPLEX CORPORATION’S KNOWLEDGE, ALL OF THE INFORMATION ON THIS PAGE IS CORRECT, AND IT IS PROVIDED IN THE HOPE THAT IT WILL BE USEFUL. HOWEVER, MARKPLEX CORPORATION ASSUMES NO LIABILITY FOR ANY DAMAGES, DIRECT OR OTHERWISE, RESULTING FROM THE USE OF THIS INFORMATION AND/OR PROGRAM(S) DESCRIBED, AND NO WARRANTY IS MADE REGARDING ITS ACCURACY OR COMPLETENESS. USE OF THIS INFORMATION AND/OR PROGRAMS DESCRIBED IS AT YOUR OWN RISK.
ANY EASYLANGUAGE OR POWERLANGUAGE TRADING STRATEGIES, SIGNALS, STUDIES, INDICATORS, SHOWME STUDIES, PAINTBAR STUDIES, PROBABILITYMAP STUDIES, ACTIVITYBAR STUDIES, FUNCTIONS (AND PARTS THEREOF) AND ASSOCIATED TECHNIQUES REFERRED TO, INCLUDED IN OR ATTACHED TO THIS TUTORIAL OR PROGRAM DESCRIPTION ARE EXAMPLES ONLY, AND HAVE BEEN INCLUDED SOLELY FOR EDUCATIONAL PURPOSES. MARKPLEX CORPORATION. DOES NOT RECOMMEND THAT YOU USE ANY SUCH TRADING STRATEGIES, SIGNALS, STUDIES, INDICATORS, SHOWME STUDIES, PAINTBAR STUDIES, PROBABILITYMAP STUDIES, ACTIVITYBAR STUDIES, FUNCTIONS (OR ANY PARTS THEREOF) OR TECHNIQUES. THE USE OF ANY SUCH TRADING STRATEGIES, SIGNALS, STUDIES, INDICATORS, SHOWME STUDIES, PAINTBAR STUDIES, PROBABILITYMAP STUDIES, ACTIVITYBAR STUDIES, FUNCTIONS AND TECHNIQUES DOES NOT GUARANTEE THAT YOU WILL MAKE PROFITS, INCREASE PROFITS, OR MINIMIZE LOSSES.

