Tutorial 18 – A simple bounded volume oscillator, applied to a CCI indicator
Welcome to tutorial 18 in this series of tutorials that demonstrate and explain TradeStation EasyLanguage programming concepts. The idea behind the series is that if you learn the TradeStation EasyLanguage yourself, you will have a skill that will enable you to program and try out trading ideas.
As always, the purpose of this tutorial is to demonstrate the programming techniques rather than to create a tradeable indicator. I am using TradeStation version 8.3 to create this tutorial.
TO THE BEST OF MARKPLEX CORPORATION’S KNOWLEDGE, ALL OF THE INFORMATION ON THIS PAGE IS CORRECT, AND IT IS PROVIDED IN THE HOPE THAT IT WILL BE USEFUL. HOWEVER, MARKPLEX CORPORATION ASSUMES NO LIABILITY FOR ANY DAMAGES, DIRECT OR OTHERWISE, RESULTING FROM THE USE OF THIS INFORMATION AND/OR PROGRAM(S) DESCRIBED, AND NO WARRANTY IS MADE REGARDING ITS ACCURACY OR COMPLETENESS. USE OF THIS INFORMATION AND/OR PROGRAMS DESCRIBED IS AT YOUR OWN RISK.
ANY EASYLANGUAGE OR POWERLANGUAGE TRADING STRATEGIES, SIGNALS, STUDIES, INDICATORS, SHOWME STUDIES, PAINTBAR STUDIES, PROBABILITYMAP STUDIES, ACTIVITYBAR STUDIES, FUNCTIONS (AND PARTS THEREOF) AND ASSOCIATED TECHNIQUES REFERRED TO, INCLUDED IN OR ATTACHED TO THIS TUTORIAL OR PROGRAM DESCRIPTION ARE EXAMPLES ONLY, AND HAVE BEEN INCLUDED SOLELY FOR EDUCATIONAL PURPOSES. MARKPLEX CORPORATION. DOES NOT RECOMMEND THAT YOU USE ANY SUCH TRADING STRATEGIES, SIGNALS, STUDIES, INDICATORS, SHOWME STUDIES, PAINTBAR STUDIES, PROBABILITYMAP STUDIES, ACTIVITYBAR STUDIES, FUNCTIONS (OR ANY PARTS THEREOF) OR TECHNIQUES. THE USE OF ANY SUCH TRADING STRATEGIES, SIGNALS, STUDIES, INDICATORS, SHOWME STUDIES, PAINTBAR STUDIES, PROBABILITYMAP STUDIES, ACTIVITYBAR STUDIES, FUNCTIONS AND TECHNIQUES DOES NOT GUARANTEE THAT YOU WILL MAKE PROFITS, INCREASE PROFITS, OR MINIMIZE LOSSES.
The (Commodity Channel Index) indicator is entirely based on price action. This means that during times of low volume the CCI may indicate a market move, that perhaps does not take place because of weak volume. The purpose of the tutorial is to modify the CCI indicator so that it displays larger values during times of high volume and comparively lesser values (than it normally would) during times of lower volume.
The first step is to create a volume oscillator. Volume is not something that oscillates within certain defined bounds. It can be anything from zero to any higher limit. In order to create an oscillator we will test the highest volume in a certain number of bars, and divide this value into the current volume. If we plot this value it will move between 0 and 1. You can determine the best number of bars to look back over.
The second step is to multiple the value of the volume oscillator by the CCI and plot the result.
Lets get started.
Step 1 – Create a simple volume oscillator.
Open Tradestation and click File – New – Window. Click the EasyLanguage tab and click ‘indicator.’. Give the new indicator a name and delete the default program. Enter the following EasyLanguage code:
Value1 = Highest(V,AvgBars);
Plot1( V/Value1,”VolOsc”);
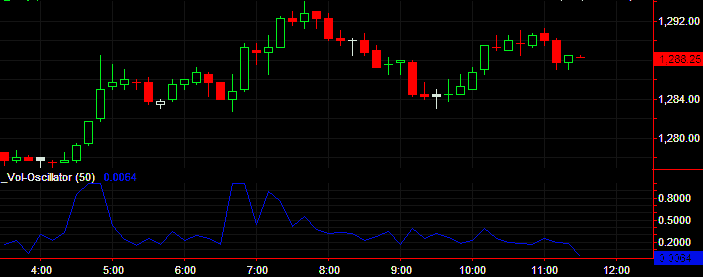
If you apply this to a chart for a symbol that includes volume data, you should see something like the following:

Note that if volume were zero, this program would give a divide by zero error.
To avoid this you could add a line such as:
This tests the value of the variable Value1. If it is zero it make it equal to 0.0001. If it is not zero it stays at the same value.
Step 2 – Apply the volume oscillator to a CCI
You could create a new indicator, or simply use the one you are already working on.
A typical CCI indicator is as follows:
SlowLength( 14 ),
FastLength( 6 );
Plot1( CCI( SlowLength ), “SlowCCI”,Green ) ;
Plot2( CCI( FastLength ), “FastCCI”,Red ) ;
Plot3( 0, “Nought”, White) ;
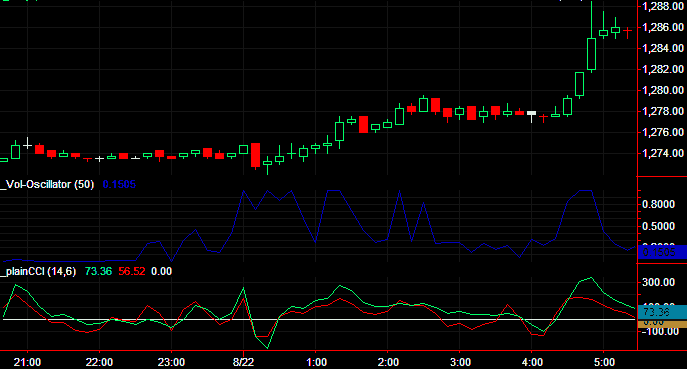
If you apply this to a chart, you should see something like the following:

In order to apply the volume oscillator, we modify the program as follows:
SlowLength( 14 ),
FastLength( 6 ),
AvgBars(50);
Value1 = IFF(Value1=0,0.0001,value1);
Plot1( CCI( SlowLength ) * V/Value1, “SlowCCI”,Green ) ;
Plot2( CCI( FastLength ) * V/Value1, “FastCCI”,Red ) ;
Plot3( 0, “Nought”, White) ;
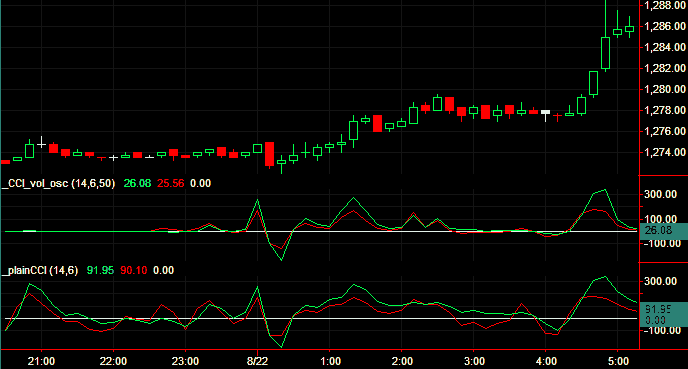
If you apply this indicator to the chart you should see the following. I left the ‘ordinary’ CCI on the chart for comparison purposes.

TO THE BEST OF MARKPLEX CORPORATION’S KNOWLEDGE, ALL OF THE INFORMATION ON THIS PAGE IS CORRECT, AND IT IS PROVIDED IN THE HOPE THAT IT WILL BE USEFUL. HOWEVER, MARKPLEX CORPORATION ASSUMES NO LIABILITY FOR ANY DAMAGES, DIRECT OR OTHERWISE, RESULTING FROM THE USE OF THIS INFORMATION AND/OR PROGRAM(S) DESCRIBED, AND NO WARRANTY IS MADE REGARDING ITS ACCURACY OR COMPLETENESS. USE OF THIS INFORMATION AND/OR PROGRAMS DESCRIBED IS AT YOUR OWN RISK.
ANY EASYLANGUAGE OR POWERLANGUAGE TRADING STRATEGIES, SIGNALS, STUDIES, INDICATORS, SHOWME STUDIES, PAINTBAR STUDIES, PROBABILITYMAP STUDIES, ACTIVITYBAR STUDIES, FUNCTIONS (AND PARTS THEREOF) AND ASSOCIATED TECHNIQUES REFERRED TO, INCLUDED IN OR ATTACHED TO THIS TUTORIAL OR PROGRAM DESCRIPTION ARE EXAMPLES ONLY, AND HAVE BEEN INCLUDED SOLELY FOR EDUCATIONAL PURPOSES. MARKPLEX CORPORATION. DOES NOT RECOMMEND THAT YOU USE ANY SUCH TRADING STRATEGIES, SIGNALS, STUDIES, INDICATORS, SHOWME STUDIES, PAINTBAR STUDIES, PROBABILITYMAP STUDIES, ACTIVITYBAR STUDIES, FUNCTIONS (OR ANY PARTS THEREOF) OR TECHNIQUES. THE USE OF ANY SUCH TRADING STRATEGIES, SIGNALS, STUDIES, INDICATORS, SHOWME STUDIES, PAINTBAR STUDIES, PROBABILITYMAP STUDIES, ACTIVITYBAR STUDIES, FUNCTIONS AND TECHNIQUES DOES NOT GUARANTEE THAT YOU WILL MAKE PROFITS, INCREASE PROFITS, OR MINIMIZE LOSSES.
If you see any errors in this tutorial – or I have not made something clear, I would be most grateful if you could please let me know. You can e-mail me at: tutorials@markplex.com. Also, let me know if you have any ideas for new tutorials.

