Welcome to tutorial 22 in this series of tutorials to help you learn TradeStation EasyLanguage programming skills. The purpose of this video tutorial is to demonstrate the programming techniques rather than to create a tradable indicator. This tutorial was created using TradeStation version 8.6.
The study created in this study may be downloaded for $14.95 here:
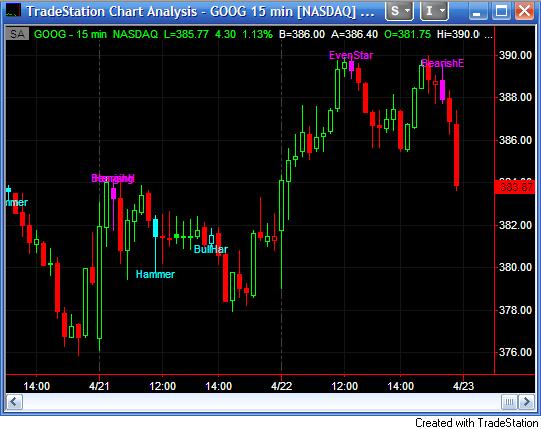
In tutorial 16 I created a simple strategy that based its signals on Stochastic values and a few candlestick patterns. This tutorial will demonstrate how to create a paintbar study to show where a greater number of candlestick patterns have occurred together with adding text to the chart above or below the patterns. The tutorial will also demonstrate how to add a stochastic ‘filter’ and how to use one of TradeStation’s candlestick functions to find other patterns.
TO THE BEST OF MARKPLEX CORPORATION’S KNOWLEDGE, ALL OF THE INFORMATION ON THIS PAGE IS CORRECT, AND IT IS PROVIDED IN THE HOPE THAT IT WILL BE USEFUL. HOWEVER, MARKPLEX CORPORATION ASSUMES NO LIABILITY FOR ANY DAMAGES, DIRECT OR OTHERWISE, RESULTING FROM THE USE OF THIS INFORMATION AND/OR PROGRAM(S) DESCRIBED, AND NO WARRANTY IS MADE REGARDING ITS ACCURACY OR COMPLETENESS. USE OF THIS INFORMATION AND/OR PROGRAMS DESCRIBED IS AT YOUR OWN RISK.
ANY EASYLANGUAGE OR POWERLANGUAGE TRADING STRATEGIES, SIGNALS, STUDIES, INDICATORS, SHOWME STUDIES, PAINTBAR STUDIES, PROBABILITYMAP STUDIES, ACTIVITYBAR STUDIES, FUNCTIONS (AND PARTS THEREOF) AND ASSOCIATED TECHNIQUES REFERRED TO, INCLUDED IN OR ATTACHED TO THIS TUTORIAL OR PROGRAM DESCRIPTION ARE EXAMPLES ONLY, AND HAVE BEEN INCLUDED SOLELY FOR EDUCATIONAL PURPOSES. MARKPLEX CORPORATION. DOES NOT RECOMMEND THAT YOU USE ANY SUCH TRADING STRATEGIES, SIGNALS, STUDIES, INDICATORS, SHOWME STUDIES, PAINTBAR STUDIES, PROBABILITYMAP STUDIES, ACTIVITYBAR STUDIES, FUNCTIONS (OR ANY PARTS THEREOF) OR TECHNIQUES. THE USE OF ANY SUCH TRADING STRATEGIES, SIGNALS, STUDIES, INDICATORS, SHOWME STUDIES, PAINTBAR STUDIES, PROBABILITYMAP STUDIES, ACTIVITYBAR STUDIES, FUNCTIONS AND TECHNIQUES DOES NOT GUARANTEE THAT YOU WILL MAKE PROFITS, INCREASE PROFITS, OR MINIMIZE LOSSES.
1. Create a new Paintbar study
Click File – New -Window, select the Easylanguage tab and click PaintBar. Alternatively click View and make sure that the ShortCut bar is selected. On the shortcut bar click EasyLanguage and then click New Paintbar.
Enter a name for the study (e.g. tutorial22-1) and press OK. A new study will fill the window. Delete any existing content and type the following:

The result is a very simple PaintBar study. Verify it by press F3, open a chart and apply it by clicking: Insert – Paintbar, and selecting the paintbar that you just created.
The patterns we are looking for so far are not very common, so you may need to adjust the bar durations before you see any paintbars plotted.
2. Add text to chart
The nest step is to add some text to indicate what sort of Candlestick pattern we have discovered.
If the EasyLanguage program that you just created is not still open, then open it and make the following changes:
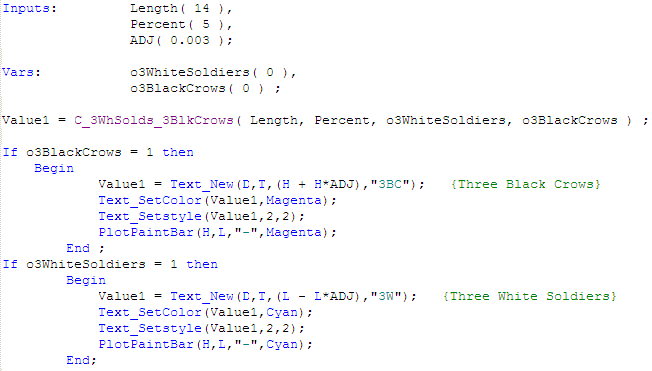
As you can see, we have added the following lines of EasyLanguage:
Text_SetColor(Value1,Magenta);
Text_Setstyle(Value1,2,2);
The Text_New statement takes the following arguments:
- The date of the bar where the text will be printed on the chart
- The time of the bar where the text will be printed
- The price value where the text will be printed
- and, what text string will be printed.
Text_SetColor sets the color of the text string and Text_Setstyle determines its position. You can gain more information about these functions by right clicking their names in the EasyLanguage window and clicking ‘Definition of …’
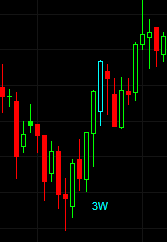
Once applied to a chart, any occurrence of one of the candlestick patterns we are searching for should look like:
Step 3: Adding additional candlestick patterns
We can now begin to add additional Candlestick pattern detection as follows:
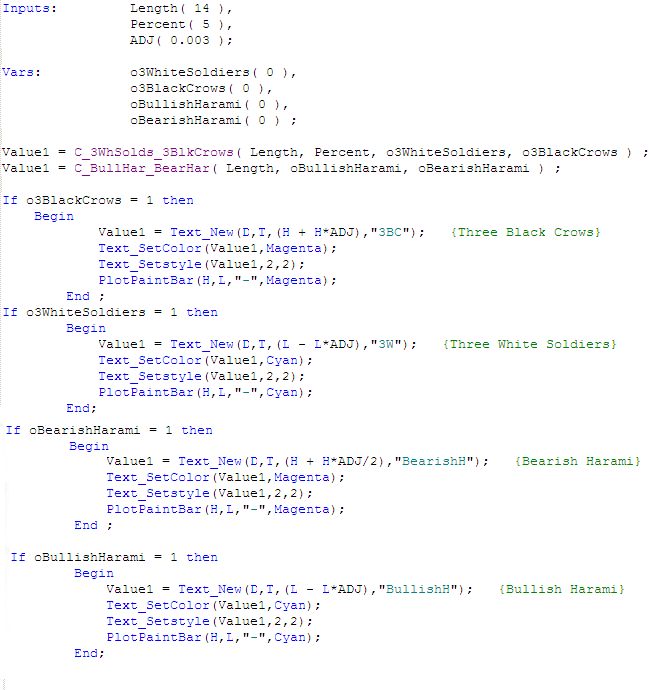
If you read through the program, you will see that we have added a new TradeStation EasyLanguage candlestick function:
This function contains 3 arguments: Length, oBullishHarami, oBearishHarami. Length is an input and we already have an input named length set up for the candlestick function that we added previously. So we need to ensure that the 2 variables: oBullishHarami, oBearishHarami are added. We achieve this by modifying the variable statement as follows:
Vars: o3WhiteSoldiers( 0 ),
o3BlackCrows( 0 ),
oBullishHarami( 0 ),
oBearishHarami( 0 ) ;
Step 4: Adding a Stochastic Filter
We might decide that using a Stochastic filter is a way to filter out candlestick patterns that do not occur at the extremities of price activity. To do this we modify the program as follows:
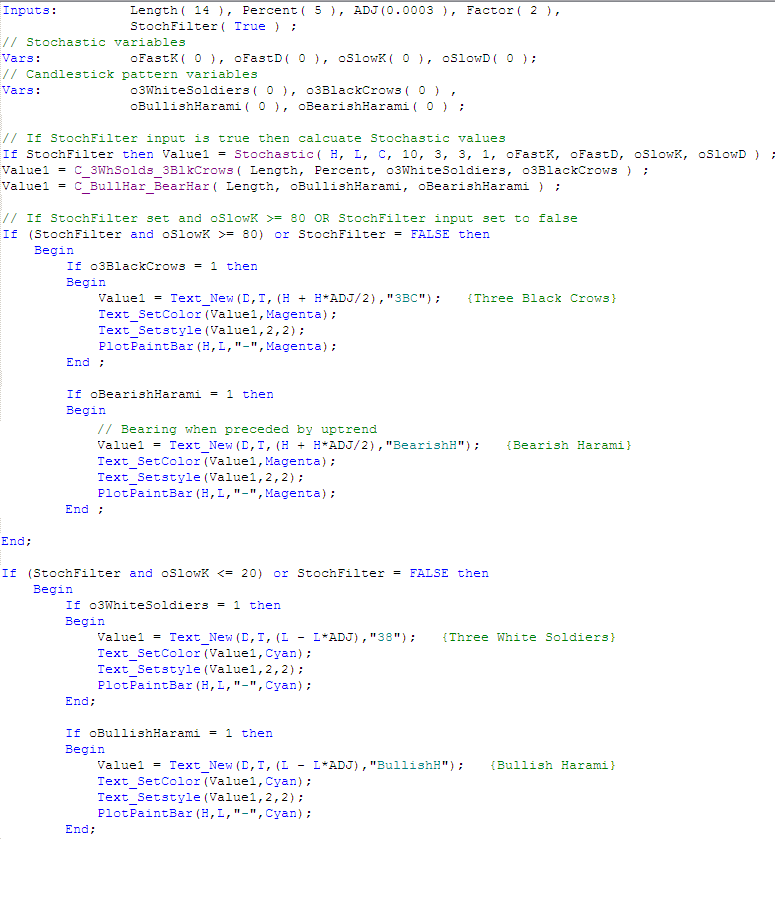
We have created a new input: StochFilter. If set to TRUE the Stochastic filter is applied, if set to FALSE it is not. We also used the EasyLanguage Stochastic function: Value1 = Stochastic( H, L, C, 10, 3, 3, 1, oFastK, oFastD, oSlowK, oSlowD ) ;
When this function is applied it returns its values in the oFastK, oFastD, oSlowK, oSlowD variables. This means we have to declare these variables, thus:
Vars: oFastK( 0 ), oFastD( 0 ), oSlowK( 0 ), oSlowD( 0 );
The If statement (If (StochFilter and oSlowK >= 80) or StochFilter = FALSE then) works as follows:
If StochFilter TRUE and oSlowK is greater or equal to 80 OR if Stochfilter is false then it checks whether any Candlestick patterns have occurred
Step 5: Completing the development
The remainder of the development of this program involves adding additional TradeStation functions to reveal additional Candlestick patterns.
The study created in this study may be downloaded for $14.95 here:

The following is an example of a chart with the PaintBar applied:
The study created in this study may be downloaded for $14.95 here:
TO THE BEST OF MARKPLEX CORPORATION’S KNOWLEDGE, ALL OF THE INFORMATION ON THIS PAGE IS CORRECT, AND IT IS PROVIDED IN THE HOPE THAT IT WILL BE USEFUL. HOWEVER, MARKPLEX CORPORATION ASSUMES NO LIABILITY FOR ANY DAMAGES, DIRECT OR OTHERWISE, RESULTING FROM THE USE OF THIS INFORMATION AND/OR PROGRAM(S) DESCRIBED, AND NO WARRANTY IS MADE REGARDING ITS ACCURACY OR COMPLETENESS. USE OF THIS INFORMATION AND/OR PROGRAMS DESCRIBED IS AT YOUR OWN RISK.
ANY EASYLANGUAGE OR POWERLANGUAGE TRADING STRATEGIES, SIGNALS, STUDIES, INDICATORS, SHOWME STUDIES, PAINTBAR STUDIES, PROBABILITYMAP STUDIES, ACTIVITYBAR STUDIES, FUNCTIONS (AND PARTS THEREOF) AND ASSOCIATED TECHNIQUES REFERRED TO, INCLUDED IN OR ATTACHED TO THIS TUTORIAL OR PROGRAM DESCRIPTION ARE EXAMPLES ONLY, AND HAVE BEEN INCLUDED SOLELY FOR EDUCATIONAL PURPOSES. MARKPLEX CORPORATION. DOES NOT RECOMMEND THAT YOU USE ANY SUCH TRADING STRATEGIES, SIGNALS, STUDIES, INDICATORS, SHOWME STUDIES, PAINTBAR STUDIES, PROBABILITYMAP STUDIES, ACTIVITYBAR STUDIES, FUNCTIONS (OR ANY PARTS THEREOF) OR TECHNIQUES. THE USE OF ANY SUCH TRADING STRATEGIES, SIGNALS, STUDIES, INDICATORS, SHOWME STUDIES, PAINTBAR STUDIES, PROBABILITYMAP STUDIES, ACTIVITYBAR STUDIES, FUNCTIONS AND TECHNIQUES DOES NOT GUARANTEE THAT YOU WILL MAKE PROFITS, INCREASE PROFITS, OR MINIMIZE LOSSES.
If you see any errors in this tutorial – or we have not made something clear, please let me know. You can e-mail us at: tutorials@markplex.com. Also, let me know if you have any ideas for new tutorials.

