Welcome to tutorial 24 in this series of tutorials to help you with your TradeStation EasyLanguage programming skills. If you have found some of my other tutorials a little ‘heavy,’ this tutorial should give some light relief while demonstrating how easy it is to create a potentially useful indicator.
Indicators can be divided in ‘bounded’ and ‘unbounded.’ A bounded indicator is one that always varies between fixed values. An example of a bounded indicator is the Relative Strength Indicator (RSI) which always varies between 0 and 100. An unbounded indicator is one for which there are no predetermined upper or lower limits. TradeStation’s volume indicator is an example of such an indicator since there is theoretically no limit to how high the volume could be.
This tutorial shows a very simple technique to convert the volume indicator into a ‘pseudo’ bounded indicator. We achieve this by dividing the volume by the largest volume of a number of bars determined by an input. So for example, if the highest volume of the last 50 bars was 1,000 and the volume of this bar is 250, we would plot a value of 250/1000 = 0.25 (actually we want the indicator to oscillate around zero, so we subtract 0.5 to give -0.25).
Whether this tool is of any practical use is up to you to decide, but the tutorial demonstrates how easy it is to create a simple indicator. It also shows how you can use the NormGradientColor function to continuously vary the color of an indicator.
When completed and applied to a chart the indicator should look something like:
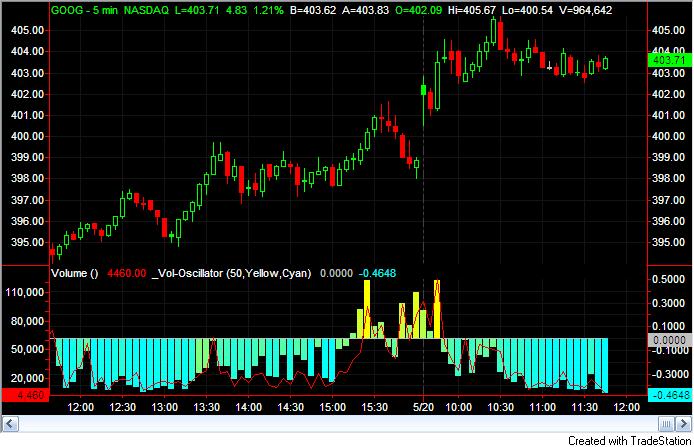
In the above chart I also applied the Volume indicator with the data plotted on the left axis of sub-graph 2 (it is the red line in the above image). As always, the purpose of this tutorial is to demonstrate the programming techniques rather than to create a tradable indicator. This tutorial was created using TradeStation version 8.6.
A download is available of this tutorial program, which works with both TradeStation and MultiCharts. An ELD file containing the program may be downloaded for $4.95.
Gold Pass members get an additional 20% discount off all program and tutorial prices. If you are a Gold Pass member make sure you enter the special coupon code to get 20% discount off these prices. You can find the coupon code on the Gold Pass page.
Step 1
Create a new indicator by clicking File – New – Window, select the EasyLanguage tab and click on indicator. Delete any template code and enter the following:
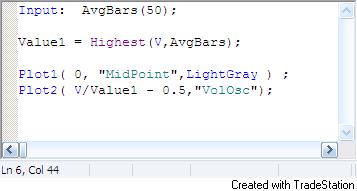
This indicator finds the highest value of volume (V) over the last AvgBars number of bars – in this case 50, and sets Value1 to this value. It then makes two plots. The first is an “x-axis” which is set to zero. The second it a plot of V divided by Value1. This value oscillates between 0 and 1. To make it oscillate between -0.5 and +0.5 we subtract 0.5.
If you apply this simple indicator to a chart (open a chart and click Insert – Indicator) you should see something like:
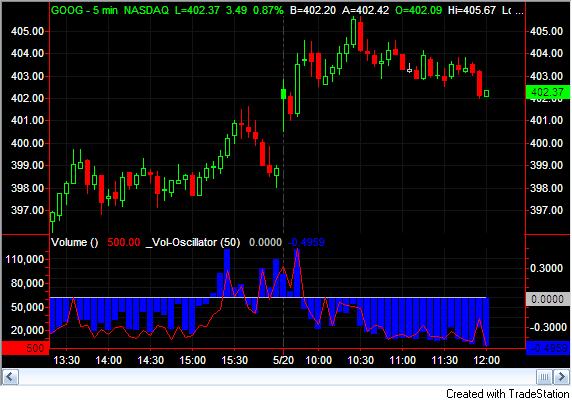
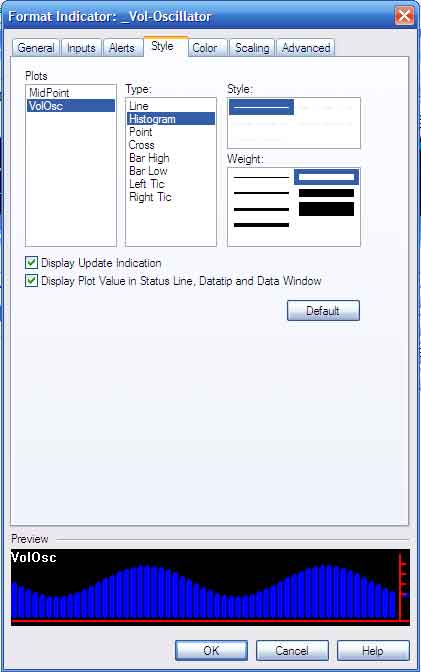
To get the histogram, you need to click Format – Analysis Techniques, double click on the name that you gave the volume oscillator and select the Style tab. Use the settings shown in the image below:
Step 2
At the beginning of the tutorial I included a screen print that showed the histogram with continuous coloring – ranging from cyan to yellow. This effect is achieved by using the NormGradientColor function.
Modify the simple volume oscillator as follows:
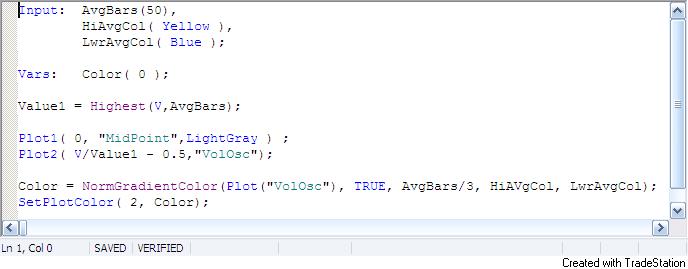
I have created two new inputs HigAvgCol and LwrAvgCol and a variable Color.
Color is calculated using the NormGradientColor function. The first input is the value that we are plotting. In this case I took the value of Plot2. The second input determines whether the value goes below zero, which it does, hence this is set to TRUE. The third input is the number of bars to consider for high or low values. Finally we enter the color for higher values (which we initially set to yellow) and the color for lower values (which we initially set to cyan).
If you apply the modified indicator to a chart you should see something like the screen print shown at the beginning of the tutorial.
I have not included comments in the above program, but it is good practice to do so. Comments may be added by including ‘//’ at the beginning of each line of comment.
NOTE: The indicator will generate a “divided by zero” error if applied to a symbol that does not have a volume attribute (e.g. FOREX symbols).
TO THE BEST OF MARKPLEX CORPORATION’S KNOWLEDGE, ALL OF THE INFORMATION ON THIS PAGE IS CORRECT, AND IT IS PROVIDED IN THE HOPE THAT IT WILL BE USEFUL. HOWEVER, MARKPLEX CORPORATION ASSUMES NO LIABILITY FOR ANY DAMAGES, DIRECT OR OTHERWISE, RESULTING FROM THE USE OF THIS INFORMATION AND/OR PROGRAM(S) DESCRIBED, AND NO WARRANTY IS MADE REGARDING ITS ACCURACY OR COMPLETENESS. USE OF THIS INFORMATION AND/OR PROGRAMS DESCRIBED IS AT YOUR OWN RISK.
ANY EASYLANGUAGE OR POWERLANGUAGE TRADING STRATEGIES, SIGNALS, STUDIES, INDICATORS, SHOWME STUDIES, PAINTBAR STUDIES, PROBABILITYMAP STUDIES, ACTIVITYBAR STUDIES, FUNCTIONS (AND PARTS THEREOF) AND ASSOCIATED TECHNIQUES REFERRED TO, INCLUDED IN OR ATTACHED TO THIS TUTORIAL OR PROGRAM DESCRIPTION ARE EXAMPLES ONLY, AND HAVE BEEN INCLUDED SOLELY FOR EDUCATIONAL PURPOSES. MARKPLEX CORPORATION. DOES NOT RECOMMEND THAT YOU USE ANY SUCH TRADING STRATEGIES, SIGNALS, STUDIES, INDICATORS, SHOWME STUDIES, PAINTBAR STUDIES, PROBABILITYMAP STUDIES, ACTIVITYBAR STUDIES, FUNCTIONS (OR ANY PARTS THEREOF) OR TECHNIQUES. THE USE OF ANY SUCH TRADING STRATEGIES, SIGNALS, STUDIES, INDICATORS, SHOWME STUDIES, PAINTBAR STUDIES, PROBABILITYMAP STUDIES, ACTIVITYBAR STUDIES, FUNCTIONS AND TECHNIQUES DOES NOT GUARANTEE THAT YOU WILL MAKE PROFITS, INCREASE PROFITS, OR MINIMIZE LOSSES.
If you see any errors in this tutorial – or I have not made something clear, I would be most grateful if you could please let me know. You can e-mail me at: tutorials@markplex.com. Also, let me know if you have any ideas for new tutorials.

