Point & Figure and three line break functions
Program 51 consists of a line break function and a point and figure function, together with a demonstration show me study that calls both the functions..
Rather than drawing boxes or crosses the functions return 1 indicating that green lines or boxes would be drawn on a line break or point and figure chart respectively and -1 indicating that red lines or boxes would be drawn on a line break or point and figure chart respectively.
The functions are described below:
Line break function
Line breaks charts ignore time. New up lines are only added when a bar closes higher than the high of the previous up line. Once up lines are being drawn price has to go below the low of a specified number of up lines in order to create a new down line. New down lines are only added when a bar closes below than the low of the previous down line. Once down lines are being drawn price has to go above the high of a specified number of down lines in order to create a new up line.

The line break function emulates how the line break lines would be created, but on a regular chart. The function does NOT draw the lines but rather returns a value indicating the current direction of the line break chart.
_3LB is a line break function that takes a single input (referring to the number of lines in the line break ).
To call this function use the following syntax: Value1 = _3LB( NumberOfLinesBreak );
where NumberOfLinesBreak is the number of lines break required. For example:
Value1 = _3LB( 3 );
The function returns 1 for upward lines and -1 for downward lines.
Point and figure function
Point and figure charts are focused purely on price action, with time being irrelevant. Price movements are filtered as a P&F chart removes some of the price ‘noise.’ For rising prices crosses are drawn on a point and figure chart, one above another. For falling prices circles or boxes are drawn on a point and figure chart, one below the other.
This function does not draw the boxes or crosses, but rather, returns a values indicating the current direction of the point and figure chart.
_PandF is a point and figure function that takes three inputs.
To call this function, use the following syntax: Value1 = _PandF( BoxSize, Reverse, HiLo );
where BoxSize is the size of the box or cross, Reverse is the number of boxes or crosses required to reverse. HiLo should be set to TRUE if you wish to use the
HiLo method or FALSE to use the close method
For example:
Value1 = _PandF( 0.05, 3, TRUE );
Program 51
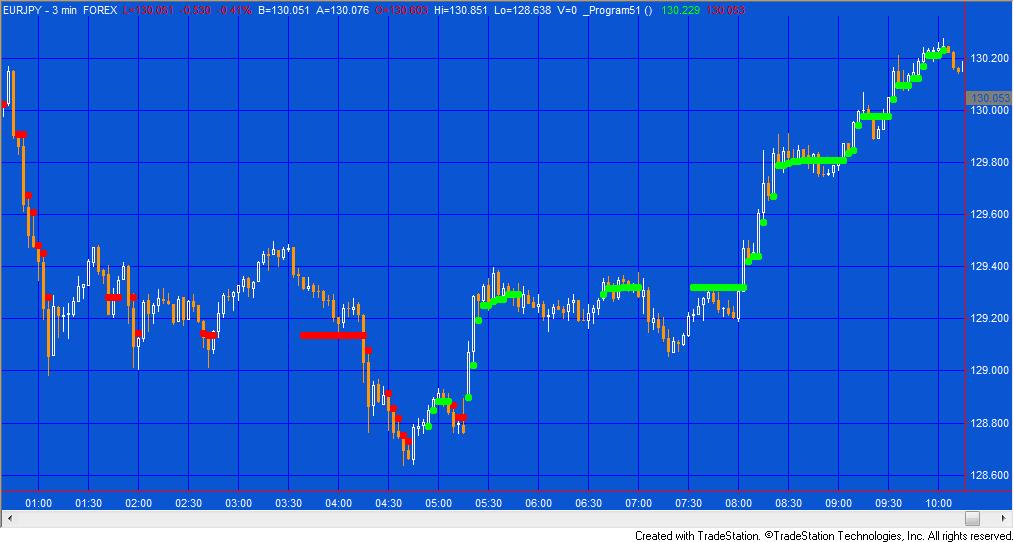
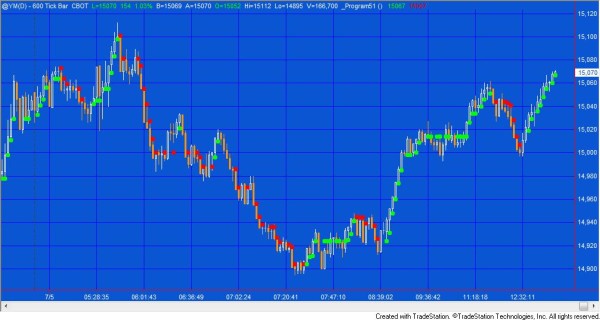
Program 51 calls both the functions described above such that when both functions are showing an upward direction it plots dots of one color. When both functions indicate a downward direction, dots are plotted of another color. The dots are plotted using trailing value so that upward dots can only be plotted at a higher low and downward dots can only be plotted at lower high.
{THIS SHOW ME STUDY IS PROVIDED IN THE HOPE THAT IT WILL BE USEFUL. HOWEVER, MARKPLEX CORPORATION ASSUMES NO LIABILITY FOR ANY DAMAGES, DIRECT OR OTHERWISE,
RESULTING FROM THE USE OF THIS INFORMATION, AND NO WARRANTY IS MADE REGARDING ITS ACCURACY OR COMPLETENESS. USE OF THIS INFORMATION IS AT YOUR OWN RISK.
THIS SHOW ME STUDY AND ASSOCIATED TECHNIQUES IS AN EXAMPLE ONLY, AND HAS BEEN INCLUDED SOLELY FOR EDUCATIONAL PURPOSES. MARKPLEX CORPORATION. DOES NOT RECOMMEND
THAT YOU USE ANY SUCH TRADING STRATEGIES, INDICATORS, SHOWME STUDIES, PAINTBAR STUDIES, PROBABILITYMAP STUDIES, ACTIVITYBAR STUDIES, FUNCTIONS
(OR ANY PARTS THEREOF) OR TECHNIQUES. THE USE OF THIS INDICATOR DOES NOT GUARANTEE THAT YOU WILL MAKE PROFITS, INCREASE PROFITS, OR MINIMIZE LOSSES.}

If _PandF( 0.05, 3, TRUE ) = 1 and _3LB( 3 ) = 1 then
Begin
Value1 = Maxlist( L, Value1 );

Plot1( Value1, "dir1" );

Value2 = 999999;
End
Else
NoPlot( 1 );

If _PandF( 0.05, 3, TRUE ) = -1 and _3LB( 3 ) = -1 then
begin
Value2 = MinList( H, Value2 );

Plot2( Value2, "dir2" );

Value1 = 0;
End
Else
NoPlot( 2 );

{ ** Copyright (c) 2013-2022 Markplex Corporation. All rights reserved. **
** Markplex Corporation reserves the right to modify or overwrite this analysis technique on its //markplex.com Web site. ** }
Program 51 was designed for TradeStation 9.1. It works on tick, intraday, daily, weekly and monthly charts.
An unprotected version of program 51 including the unprotected functions is available for download for $74.95.
I have recorded a short video that demonstrates how to use the Markplex.com shopping cart to immediately download a program and import it into TradeStation.
Gold Pass members get an additional 20% discount off all program and tutorial prices. If you are a Gold Pass member make sure you enter the special coupon code to get 20% discount off these prices. You can find the coupon code on the Gold Pass page.
Video explaining program 51 and how to use the functions
Program 51 was designed for TradeStation 9.1. It works on tick, intraday, daily, weekly and monthly charts.
An unprotected version of program 51 including the unprotected functions is available for download for $74.95.
I have recorded a short video that demonstrates how to use the Markplex.com shopping cart to immediately download a program and import it into TradeStation.
Gold Pass members get an additional 20% discount off all program and tutorial prices. If you are a Gold Pass member make sure you enter the special coupon code to get 20% discount off these prices. You can find the coupon code on the Gold Pass page.

Please note that any screen shots on this site are examples and are not meant to imply that any of these programs will generate profitable trades.
THESE INDICATORS, SHOW ME STUDIES, STRATEGIES AND OTHER PROGRAMS HAVE BEEN INCLUDED SOLELY FOR EDUCATIONAL PURPOSES.TO THE BEST OF MARKPLEX CORPORATION’S KNOWLEDGE, ALL OF THE INFORMATION ON THIS PAGE IS CORRECT, AND IT IS PROVIDED IN THE HOPE THAT IT WILL BE USEFUL. HOWEVER, MARKPLEX CORPORATION ASSUMES NO LIABILITY FOR ANY DAMAGES, DIRECT OR OTHERWISE, RESULTING FROM THE USE OF THIS INFORMATION AND/OR PROGRAM(S) DESCRIBED, AND NO WARRANTY IS MADE REGARDING ITS ACCURACY OR COMPLETENESS. USE OF THIS INFORMATION AND/OR PROGRAMS DESCRIBED IS AT YOUR OWN RISK.
ANY EASYLANGUAGE OR POWERLANGUAGE TRADING STRATEGIES, SIGNALS, STUDIES, INDICATORS, SHOWME STUDIES, PAINTBAR STUDIES, PROBABILITYMAP STUDIES, ACTIVITYBAR STUDIES, FUNCTIONS (AND PARTS THEREOF) AND ASSOCIATED TECHNIQUES REFERRED TO, INCLUDED IN OR ATTACHED TO THIS TUTORIAL OR PROGRAM DESCRIPTION ARE EXAMPLES ONLY, AND HAVE BEEN INCLUDED SOLELY FOR EDUCATIONAL PURPOSES. MARKPLEX CORPORATION. DOES NOT RECOMMEND THAT YOU USE ANY SUCH TRADING STRATEGIES, SIGNALS, STUDIES, INDICATORS, SHOWME STUDIES, PAINTBAR STUDIES, PROBABILITYMAP STUDIES, ACTIVITYBAR STUDIES, FUNCTIONS (OR ANY PARTS THEREOF) OR TECHNIQUES. THE USE OF ANY SUCH TRADING STRATEGIES, SIGNALS, STUDIES, INDICATORS, SHOWME STUDIES, PAINTBAR STUDIES, PROBABILITYMAP STUDIES, ACTIVITYBAR STUDIES, FUNCTIONS AND TECHNIQUES DOES NOT GUARANTEE THAT YOU WILL MAKE PROFITS, INCREASE PROFITS, OR MINIMIZE LOSSES.

