Drawing trendlines using BNPoint objects
Welcome to Markplex tutorial 104 in this collection of tutorials designed to help you learn TradeStation EasyLanguage programming skills. Please join our email list if you have not already done so and we will let you know when we release new tutorials or programs.

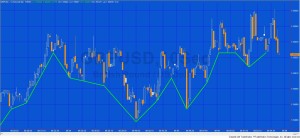
Tutorial 104 demonstrates how to draw (and style) trend lines using TradeStation drawing objects. One of the advantages of using this technique (when compared to TradeStation legacy trendlines) is that it is possible to draw the line to an exact bar. This means that this technique can be used on seconds, tick and other charts where a several bars may share same data and time (when expressed in minutes).
In this tutorial I draw trend lines between adjacent low pivots.
This tutorial applies to TradeStation (but not MultiCharts) because it uses TradeStation’s new drawing objects.
Drawing legacy trendlines
In the past, trend lines have been drawn using the following function:
Value1 = TL_New( StartDate, StartTime, StartPrice, EndDate, EndTime, EndPrice );
Dates use YYMMDD or YYYMMDD format (three digits are used to express the year 2000 and later), and times use 24-hour format, HHMM.
The problem with it is that on certain charts several bars might have the same HHMM stamp which can lead to unexpected results on tick and seconds charts.
New drawing objects
In the new technique that I demonstrate in the video, we create a pair of BNPoint objects using a bar number and price. The trend line is created and styled and then added to the chart. I demonstrate this in the video below.
Two potential ‘gotchas’
Gotcha 1
A BNPoint refers to the absolute bar index (zero-based) of the collection of bars in a chart. This is not the same as the BarNumber function or CurrentBar reserved word which count the number of bars available for analysis after MaxBarsBack. So to create a BNPoint for the current bar (BarNumber) would be:
NewBar = BarNumber + MaxBarsBack – 1;
Gotcha 2
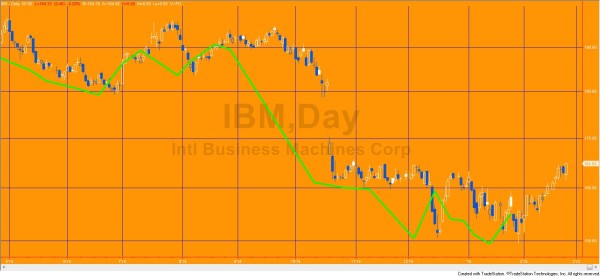
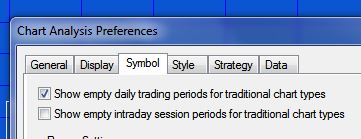
Another issue that can cause what appear to be spurious results are the ‘Show empty daily trading periods for traditional chart types’ and ‘Show empty intraday session periods for traditional chart types’ settings.
If these are selected, the chart includes blank bars which ‘confuse’ the bar number for BNPoints. For example, in the following daily chart of IBM, the ‘Show empty daily trading periods for traditional chart types’ is selected. The chart looks like the following (notice how the pivots and the lines do not line up correctly):

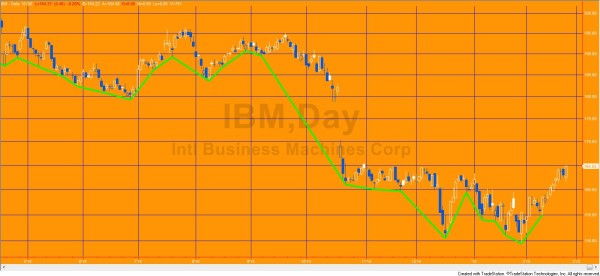
In the following chart all settings are identical apart from “Show empty daily trading periods for traditional chart types” is deselected.

Inputs
// Pivot inputs
int LeftStrength( 3 ), // Left strength of pivots
int RightStrength( 3 ), // Right strength of pivots
// Trendline attributes
int TLWeight( 3 ), // Determines the thickness oof the trendline. Valid numbers are integers between 0 and 6
int TLStyle( 0 ), // 0 = solid, 1 = dashed, 2 = dotted, 3 = dashed2, 4 = dashed3
int TLTransparency( 255 ), // Sets the alpha component (transparency) of this color structure, where 0 is fully transparent and 255 is fully opaque
string LowerColor( “Green” ); // Color of lines indicating possible bullish divergence
This tutorial program is available for immediate download for only $14.95. This tutorial applies to TradeStation (but not MultiCharts) because it uses TradeStation’s object oriented extensions.
Gold pass members can download the program ELD at no cost (see the Gold Pass area below. Make sure you are logged in to the site).
Gold pass area
Tutorial 104 video
For best results, watch this video in full screen HD mode.
This tutorial program is available for immediate download for only $19.95. This tutorial applies to TradeStation (but not MultiCharts) because it uses some of TradeStation’s object oriented extensions.
Gold Pass members get an additional 20% discount off all program and tutorial prices. If you are a Gold Pass member make sure you enter the special coupon code to get 20% discount off these prices. You can find the coupon code on the Gold Pass page.
TO THE BEST OF MARKPLEX CORPORATION’S KNOWLEDGE, ALL OF THE INFORMATION ON THIS PAGE IS CORRECT, AND IT IS PROVIDED IN THE HOPE THAT IT WILL BE USEFUL. HOWEVER, MARKPLEX CORPORATION ASSUMES NO LIABILITY FOR ANY DAMAGES, DIRECT OR OTHERWISE, RESULTING FROM THE USE OF THIS INFORMATION AND/OR PROGRAM(S) DESCRIBED, AND NO WARRANTY IS MADE REGARDING ITS ACCURACY OR COMPLETENESS. USE OF THIS INFORMATION AND/OR PROGRAMS DESCRIBED IS AT YOUR OWN RISK.
ANY EASYLANGUAGE OR POWERLANGUAGE TRADING STRATEGIES, SIGNALS, STUDIES, INDICATORS, SHOWME STUDIES, PAINTBAR STUDIES, PROBABILITYMAP STUDIES, ACTIVITYBAR STUDIES, FUNCTIONS (AND PARTS THEREOF) AND ASSOCIATED TECHNIQUES REFERRED TO, INCLUDED IN OR ATTACHED TO THIS TUTORIAL OR PROGRAM DESCRIPTION ARE EXAMPLES ONLY, AND HAVE BEEN INCLUDED SOLELY FOR EDUCATIONAL PURPOSES. MARKPLEX CORPORATION. DOES NOT RECOMMEND THAT YOU USE ANY SUCH TRADING STRATEGIES, SIGNALS, STUDIES, INDICATORS, SHOWME STUDIES, PAINTBAR STUDIES, PROBABILITYMAP STUDIES, ACTIVITYBAR STUDIES, FUNCTIONS (OR ANY PARTS THEREOF) OR TECHNIQUES. THE USE OF ANY SUCH TRADING STRATEGIES, SIGNALS, STUDIES, INDICATORS, SHOWME STUDIES, PAINTBAR STUDIES, PROBABILITYMAP STUDIES, ACTIVITYBAR STUDIES, FUNCTIONS AND TECHNIQUES DOES NOT GUARANTEE THAT YOU WILL MAKE PROFITS, INCREASE PROFITS, OR MINIMIZE LOSSES.


