Pivot line tester
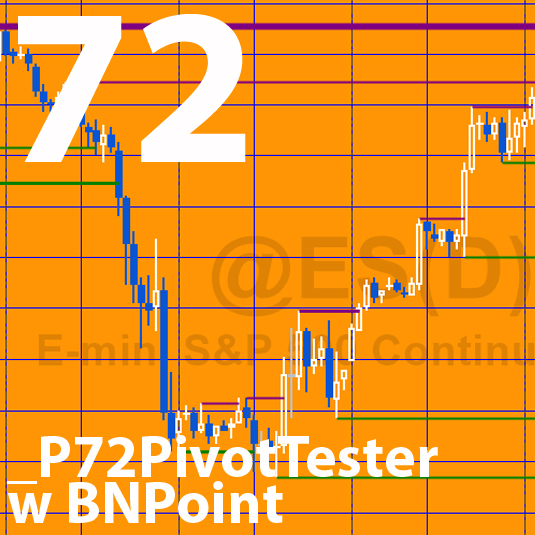
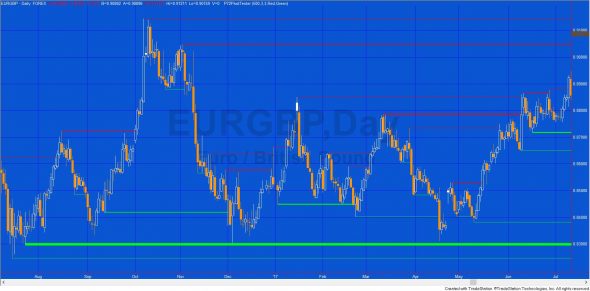
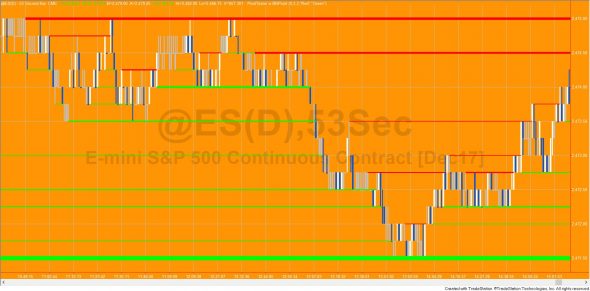
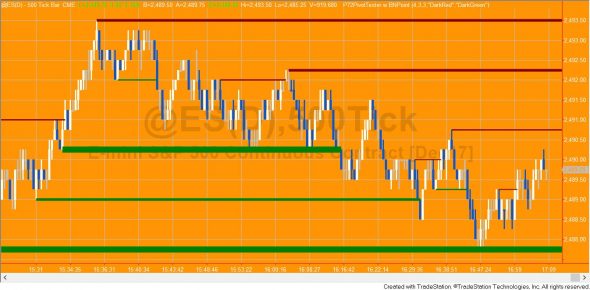
Program 72 looks for high and low pivots. Each time a pivot is found it is compared with previous pivots. If it is not within a user defined price from a previous pivot a new horizontal pivot line is drawn which is extended to the right of the chart. If the new pivot IS within a user defined price from a previous pivot the thickness of the existing horizontal line is increased. If the price crosses a pivot line, that line is discontinued. The color of the lines is determined by whether they were drawn for a low pivot or a high pivot.
The possible implication is that a thicker line represents a ‘strong’ support or resistance, and once broken might suggest a break-out from a trading range.
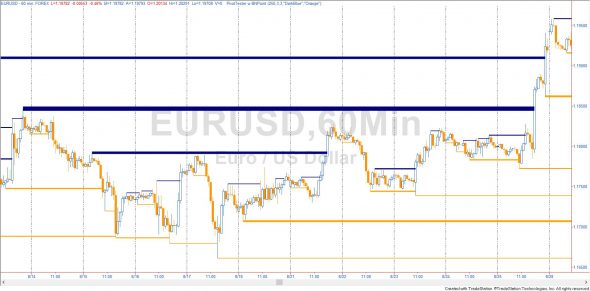
In order to reduce the total number of drawing objects on the chart, the oldest objects are deleted after 500 objects have been added.
The first ( _P72_PivotTester) uses a two dimensional array to keep track of the pivot lines and uses the legacy TradeStation drawing functions (such as TL_New(….)). This version of the program is compatible with Multicharts.
The second program (_P72_PivotTester w BNPoint) uses a vector to keep track of drawing objects. It uses the new TradeStation drawing object technlogy (such as BNPoint). This version will work with tick/second/ volume charts.
Both the programs are available for immediate download. The first program is available for free for Gold Pass members.
Video demonstration
Program download
[download_box]_P72PivotTester is available for for IMMEDIATE download for $29- by clicking the following ‘add to cart’ button.
_P72PivotTester w BNPoint is available for for IMMEDIATE download for $39- by clicking the following ‘add to cart’ button.
These TradeStation EasyLanguage programs are fully functional and unprotected, i.e. you can see the source code.
After download the program can be opened, you will be able to see the program code and modify it. After purchase you will be redirected to a download page, so don’t close the browser.
If you are a Gold Pass member _P72PivotTester is available at no cost in a Gold Pass member’s area below.
[/download_box]
Technical differences between the two programs
The functionality between the two programs are very similar. The main differences between the two are their technical architecture and the fact that this program will not work accurately on charts that use sub-minute time stamps due to the limitations of the TL_New function.
[colored_box title=”_P72_PivotTester Technical lessons” variation=”orange”]
- Create and cycle through an array
- Draw horizontal lines using TL_New.
- Query and modify the thickness of line
- Use TL_SetExtRight to extend lines to the right
- Set the end of a line when crossed by price action[/colored_box]
[colored_box title=”_P72_PivotTester w BNPoint Technical lessons” variation=”teal”]
- Use a vector (rather than an array)
- Using namespaces
- Using BNPoint and Trendline.Create
- Query and modify trend line thickness/weight and color
- Deleting drawing objects[/colored_box]
Gold Pass area
_P72PivotTester inputs
- int Multiplier( 2 ), // Define how many times the minimum move a pivot can be from a previous pivot for a merge
- int LeftStrength( 3 ), // Left strength of a pivot
- int RightStrength( 3 ), // Right strength of a pivot
- int HiPivLineCol( Red ), // Lines that started as a high pivot given this color
- int LoPivLineCol( Green ); // Lines that started as a low pivot given this color
_P72PivotTester w BNPoint inputs
- int Multiplier( 2 ), // Define how many times the minimum move a pivot can be from a previous pivot for a merge
- int LeftStrength( 3 ), // Left strength of a pivot
- int RightStrength( 3 ), // Right strength of a pivot
- string HiPivLineCol( “Red” ), // Lines that started as a high pivot given this color
- string LoPivLineCol( “Green” ); // Lines that started as a low pivot given this color
Notice that the inputs are virtually the same between the two programs except that the color of lines’ inputs are integers in the first program and strings in the second. This reflects the different ways of dealing with color in the legacy code.
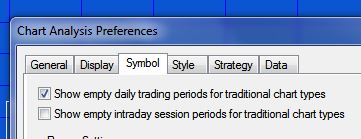
When using _P72PivotTester w BNPoint, make sure that ‘Show empty daily trading periods for traditional chart types’ and ‘Show empty intraday session periods for traditional chart types’ are not selected. These can be found by clicking View – Chart Analysis Preferences
If these are selected, the chart includes blank bars which ‘confuse’ the bar number for BNPoints.
Note that _P72PivotTester w BNPoint was developed for TradeStation 9.5 and above and is not compatible with MultiCharts because of some of the drawing technology used.


