Plotting a stochastic from a higher time frame on a lower timeframe chart
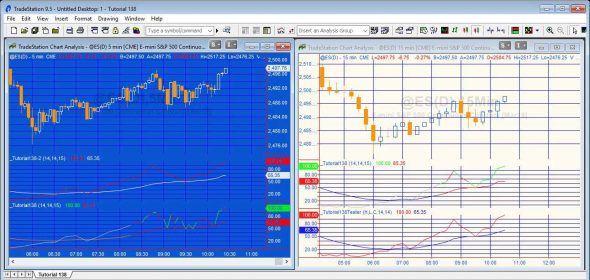
 Video based tutorial 138 demonstrates how to plot a stochastic (FastK) and a smoothed stochastic (FastD) for a 15 minute chart, on a 5 minute chart using the Price Series Provider (PSP). The program demonstrated in this tutorial is free to Gold Pass members and can be downloaded by others at a nominal cost.

Inputs and data settings
The tutorial program has the following inputs:
int StochLength( 14 ), // The stochastic length
int SlowLen( 14 ), // The length to smooth FastK to Fast D (using the legacy calculation)
int BarSpan( 15 ); // Bar span of the higher time frame chart (expressed in minutes)
- Creating a Price Series Provider with update event
- Automatically setting the first datetime of the PSP is set to the datetime of the first bar after MaxBarsBack
- Automatically setting the PSP to use local or exchange according to the timezone of the chart
- Detecting when a real time PSP bar is over
- Calculating the Stochastic and Exponential Moving Average for a PSP bar
How the tutorial 138 program works
Calculating FastK
For historic bars, the program checks for when the time of the PSP bar changes. It checks that the PSP count is sufficient and then calculates FastK using the standard stochastic calculation on the PSP data series: PSP.Low and PSP.High and the close of the current bar: PSP.Close[0]. It then stores the current time of the PSP in a variable which is monitored to detect when the time of the PSP bar has changed.
For real time bars, the standard stochastic calculation takes place in the PSP update event.
Calculating FastD (using an exponential moving average to smooth FastK)
For the historic bars, the program checks for when the time of the PSP bar changes. FastD is initially set to equal FastK. For subsequent bars FastD is set to equal the value of FastD the previous PSP bar plus the smoothing factor (calculated once) multiplied by FastK less the value of FastD the previous PSP bar. The value of FastD is saved to an intrabarpersist variable on the last tick of the bar.
An identical calculation is used for real time bars in the PSP update event, except the value of FastD is saved to the intrabarpersist variable on the (PSP) bar close event.
Download
Free download for Gold Pass members
Video explanation of Tutorial 138 Part 1
Video explanation of Tutorial 138 Part 2
Please let me know if you see any mistakes or errors or have questions.
THESE INDICATORS, SHOW ME STUDIES, STRATEGIES AND OTHER PROGRAMS HAVE BEEN INCLUDED SOLELY FOR EDUCATIONAL PURPOSES.
TO THE BEST OF MARKPLEX CORPORATION’S KNOWLEDGE, ALL OF THE INFORMATION ON THIS PAGE IS CORRECT, AND IT IS PROVIDED IN THE HOPE THAT IT WILL BE USEFUL. HOWEVER, MARKPLEX CORPORATION ASSUMES NO LIABILITY FOR ANY DAMAGES, DIRECT OR OTHERWISE, RESULTING FROM THE USE OF THIS INFORMATION AND/OR PROGRAM(S) DESCRIBED, AND NO WARRANTY IS MADE REGARDING ITS ACCURACY OR COMPLETENESS. USE OF THIS INFORMATION AND/OR PROGRAMS DESCRIBED IS AT YOUR OWN RISK.
ANY EASYLANGUAGE OR POWERLANGUAGE TRADING STRATEGIES, SIGNALS, STUDIES, INDICATORS, SHOWME STUDIES, PAINTBAR STUDIES, PROBABILITYMAP STUDIES, ACTIVITYBAR STUDIES, FUNCTIONS (AND PARTS THEREOF) AND ASSOCIATED TECHNIQUES REFERRED TO, INCLUDED IN OR ATTACHED TO THIS TUTORIAL OR PROGRAM DESCRIPTION ARE EXAMPLES ONLY, AND HAVE BEEN INCLUDED SOLELY FOR EDUCATIONAL PURPOSES. MARKPLEX CORPORATION. DOES NOT RECOMMEND THAT YOU USE ANY SUCH TRADING STRATEGIES, SIGNALS, STUDIES, INDICATORS, SHOWME STUDIES, PAINTBAR STUDIES, PROBABILITYMAP STUDIES, ACTIVITYBAR STUDIES, FUNCTIONS (OR ANY PARTS THEREOF) OR TECHNIQUES. THE USE OF ANY SUCH TRADING STRATEGIES, SIGNALS, STUDIES, INDICATORS, SHOWME STUDIES, PAINTBAR STUDIES, PROBABILITYMAP STUDIES, ACTIVITYBAR STUDIES, FUNCTIONS AND TECHNIQUES DOES NOT GUARANTEE THAT YOU WILL MAKE PROFITS, INCREASE PROFITS, OR MINIMIZE LOSSES.

