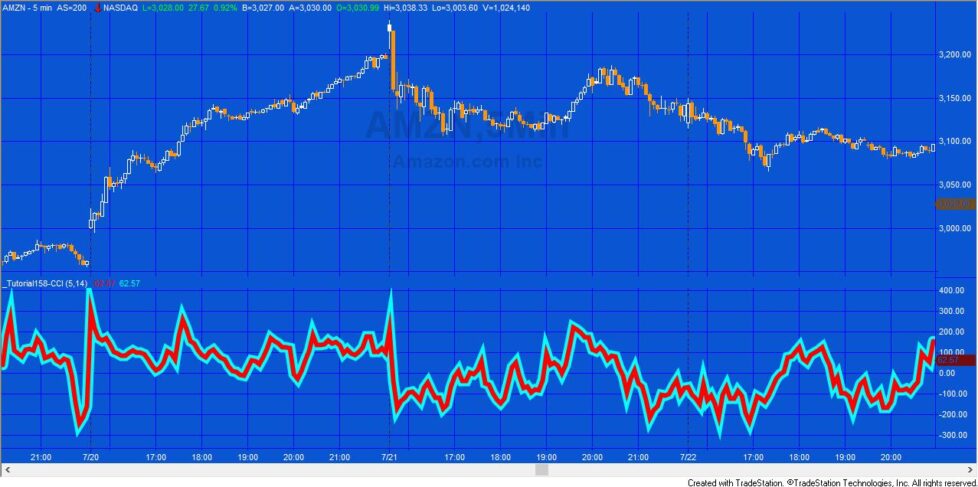
A Markplex subscriber asked for a tutorial about calculating the Commodity Channel Index (CCI) using a TradeStation Price series Provider (PSP).
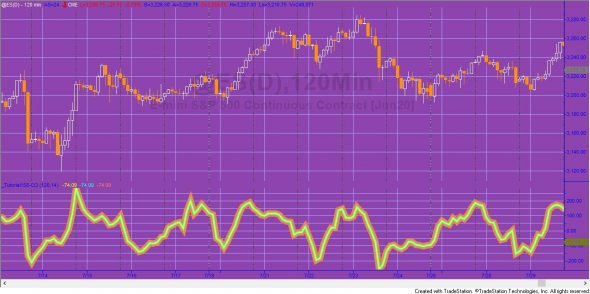
Tutorial 158 calculates the Commodity Channel Index (CCI) within an indicator, using the same calculation as the CCI function, but used inline in the program for the bars on the chart. A price series provider (PSP) is added to the program using the toolbox. Some initial configuration is done in the properties tab. Further setup for the PSP is done in a once statement: this includes code to load PSP data from the start of the chart, and to set the PSP time zone to be the same as the chart.
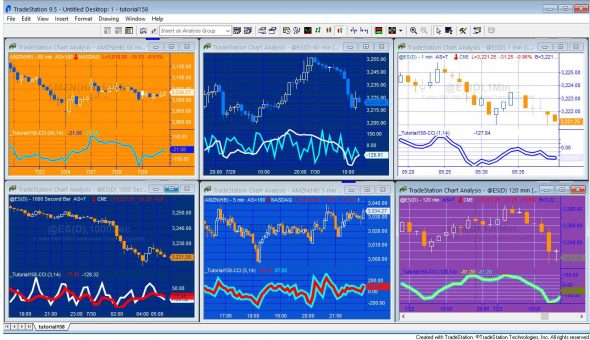
The CCI calculation is then ‘converted’ for use with the price series provider. Both the chart data and PSP data CCIs are plotted.
The program has been tested with minute bars.

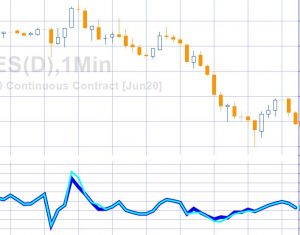
PSPs and price data are not totally synchronized. This can result in certain price ticks occurring in the following or preceding bar. This, in turn, affects the CCI calculation. In the image on the right the cyan line is the CCI calculated using the chart bar data. The blue line is calculated using PSP data.
Programming notes
The tutorial program contains examples of the use of:
- Price series provider
- Determining if the chart is on exchange or local time

Tutorial 158 video
The unprotected and commented program (i.e. the TradeStation EasyLanguage Indicator):
- _Tutorial158-CCI
is available for immediate download for $24.95 by clicking the following ‘add to cart’ button where you may pay with a credit card or by using PayPal.
The program is compatible with versions TradeStation 9.5 and above, including 10. It is not compatible with MultiCharts.
Questions and answers
Q. Could I ask why I would want to use this CCI instead of the standard version?
A. You might use it if, for example, you had a 5 minute chart, but you wanted to use a CCI based on a 60 minute chart. If used in a strategy and the strategy were optimized, the CCI bar interval could be a value that is optimized.
However the main purpose of the tutorial was to show how functionality could be ‘translated’ for use with a price series provider.
Q. You said that the PSP does not work for MultiCharts. Is there anything similar that will work in Multicharts?
A. I don’t beleive there is anything directly comparable. It is possible that someone has created something that creates similar results with MultiCharts.NET version, but I am not aware of anything.
THE TRADING APPS, INDICATORS, SHOW ME STUDIES, STRATEGIES AND OTHER PROGRAMS HAVE BEEN INCLUDED SOLELY FOR EDUCATIONAL PURPOSES.
TO THE BEST OF MARKPLEX CORPORATION’S KNOWLEDGE, ALL OF THE INFORMATION ON THIS PAGE IS CORRECT, AND IT IS PROVIDED IN THE HOPE THAT IT WILL BE USEFUL. HOWEVER, MARKPLEX CORPORATION ASSUMES NO LIABILITY FOR ANY DAMAGES, DIRECT OR OTHERWISE, RESULTING FROM THE USE OF THIS INFORMATION AND/OR PROGRAM(S) DESCRIBED, AND NO WARRANTY IS MADE REGARDING ITS ACCURACY OR COMPLETENESS. USE OF THIS INFORMATION AND/OR PROGRAMS DESCRIBED IS AT YOUR OWN RISK.
ANY EASYLANGUAGE OR POWERLANGUAGE TRADING STRATEGIES, TRADING APPS, SIGNALS, STUDIES, INDICATORS, SHOWME STUDIES, PAINTBAR STUDIES, PROBABILITYMAP STUDIES, ACTIVITYBAR STUDIES, FUNCTIONS (AND PARTS THEREOF) AND ASSOCIATED TECHNIQUES REFERRED TO, INCLUDED IN OR ATTACHED TO THIS TUTORIAL OR PROGRAM DESCRIPTION ARE EXAMPLES ONLY, AND HAVE BEEN INCLUDED SOLELY FOR EDUCATIONAL PURPOSES. MARKPLEX CORPORATION. DOES NOT RECOMMEND THAT YOU USE ANY SUCH TRADING STRATEGIES, SIGNALS, STUDIES, INDICATORS, SHOWME STUDIES, PAINTBAR STUDIES, PROBABILITYMAP STUDIES, ACTIVITYBAR STUDIES, FUNCTIONS (OR ANY PARTS THEREOF) OR TECHNIQUES. THE USE OF ANY SUCH TRADING STRATEGIES, SIGNALS, STUDIES, INDICATORS, SHOWME STUDIES, PAINTBAR STUDIES, PROBABILITYMAP STUDIES, ACTIVITYBAR STUDIES, FUNCTIONS AND TECHNIQUES DOES NOT GUARANTEE THAT YOU WILL MAKE PROFITS, INCREASE PROFITS, OR MINIMIZE LOSSES.


