
Fibonacci-Confluence Show-Me Study
Overview
Some technical analysts believe that the Fibonacci levels drawn between high and low ‘pivots’ or ‘turning points’ hold special significance. This program seeks to find Fibonacci levels that are close to those found previously on the chart (within a specified user inputted tolerance) and highlights these levels.
This program is available for immediate download for $74.95 by clicking the following button to pay using PayPal or credit card. The program works with versions 8.7 and above, including TradeStation version 10 and MultiCharts.
This Fibonacci-Confluence show-me study works by drawing percentage based zig zag lines and each time a new zig zag line is confirmed, Fibonacci levels are calculated. An array is created which stores Fibonacci levels. If a new Fibonacci level is found to be within a certain tolerance of an existing Fibonacci level stored in the array, it is ‘merged’ with the existing line. This is done by increasing the thickness parameter of the line. Lines are extended to the right if their thickness parameter is greater than an input value. The maximum thickness of a line plotted is TradeStation line thickness 4.
The following image shows the program applied to a 60 minute chart of the S&P 500 e-mini.
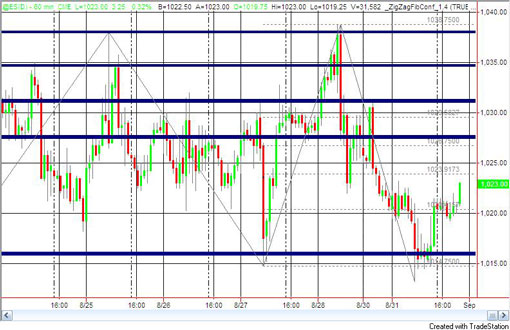
The zig-zag lines can be seen going from one low pivot to next high pivot and to the next low pivot. The last zig-zag line is still in formation, in other words, if a lower pivot is formed before the next high pivot that exceeds the required percentage change, then the last zig-zag line is extended to the next lower pivot. The Fibonacci levels are plotted and labeled based on the previous (confirmed) zig-zag line. The dark blue lines represent the the ‘significant’ Fibonaci levels based on previous Fibonacci levels calculated for each confirmed zig-zag line.
The following video explains the use of the program in more detail.
This program is available for immediate download for $74.95 by clicking the following button to pay using PayPal or credit card. The program works with versions 8.7 and above, including TradeStation version 10 and MultiCharts
The program is unprotected, in other words, you will be able to see the program code.
I have included extensive comments in the code to help you understand how it works.
Details of the program
The zig zag
The following program inputs control the way the zig zag works:
ShowZigZag( TRUE )
This is set to true if you want the zig zag lines to be shown or false if you do not. The zig zag is calculated anyway in order to calculate the Fibonacci levels.
ZigZagCol( DarkGray)
This determines the color of the zig zag lines, if plotted.
LeftStrength( 3 )
This specifies the number of bars that must be higher than pivot to the left of the pivot, for the bar to constitute a pivot
RightStrength( 3 )
This specifies the number of bars that must be higher than pivot to the right of the pivot
RetracePerc( 10 )
The RetracePerc input is best explained by way of example. Assume that the last low pivot has been determined, and we are now drawing an up zig zag line. In order to start a new down zig zag line, a new low pivot must be formed at the last high pivot multiplied by (1 – RetracePerc / 100). In the same way, if we assume that the last high pivot has been determined, and we are now drawing a down zig zag line. In order to start a new up zig zag line, a new high pivot must be formed at the last low pivot multiplied by (1 + RetracePerc / 100). This is similar to the way the standard TradeStation indicator: ZigZag % works, except that the first Markplex zig zag is calculated in a different way and the TradeStation indicator calculated zig zags based on close, rather than high and low values. It also does not allow you to specify the left and right number of bars that are required to confirm a pivot.
Fibonacci Calculation
The program calculates the Fibonacci levels using the following factors:
Ratio1( 1.61803 ),
Ratio2( 1.00000 ),
Ratio3( 0.61803 ),
Ratio4( 0.50000 ),
Ratio5( 0.38197 ),
Ratio6( 0.23607 ),
Ratio7( 0.00000 ),
Ratio8( -0.38197 ),
Ratio9( -0.50000 ),
Ratio10( -0.61803 ),
and Ratio11( -1.00000 ).
So, for example, say a low pivot was formed at a value of 10 and then a high pivot was formed at 15, Fibonacci levels would be calculated as follows:
10 + (15 – 10) * 1.61803
10 + (15 – 10)
10 + (15 – 10) * 0.61803
10 + (15 – 10) * 0.5
10 + (15 – 10) * 0.38197
10
10 – (15 – 10) * 0.38197
10 – (15 – 10) * 0.5
10 – (15 – 10) * 0.61803
10 – (15 – 10)
The following inputs control how the Fibonacci levels are plotted:
DecPlaces( 4 )
The number of decimal places displayed in the Fib levels for the most recent confirmed zig zag on the right of the chart
DrawFibs( FALSE )
Set to TRUE to see Fib levels on most recent CONFIRMED (i.e. not going to change) zigzag
Calculation and display of significant Fibonacci lines
NumberPivots( 10 )
The number of Fibonacci combination lines to be included in the array (up to 500)
CombineVal( 0 )
Numeric value above or below Fibonacci line for existing line to be combined
CombineCol( Blue )
Color of combined lines
LineSensitivity( 0 )
If the ‘thickness’ of the combined significant Fibonacci line is equal to or greater than this number then the line is extended to the right
SrtArray( TRUE )
If set to TRUE the significant Fibonacci line array is sorted prior to evaluating Fibonacci levels that have just been discovered on the formation of the new zig zag line.
This program is available for immediate download for $74.95 by clicking the following button to pay using PayPal or credit card. The program works with versions 8.7 and above, including TradeStation version 10 and MultiCharts
The program is unprotected, in other words, you will be able to see the program code.
I have included extensive comments in the code to help you understand how it works.
TO THE BEST OF MARKPLEX CORPORATION’S KNOWLEDGE, ALL OF THE INFORMATION ON THIS PAGE IS CORRECT, AND IT IS PROVIDED IN THE HOPE THAT IT WILL BE USEFUL. HOWEVER, MARKPLEX CORPORATION ASSUMES NO LIABILITY FOR ANY DAMAGES, DIRECT OR OTHERWISE, RESULTING FROM THE USE OF THIS INFORMATION AND/OR PROGRAM(S) DESCRIBED, AND NO WARRANTY IS MADE REGARDING ITS ACCURACY OR COMPLETENESS. USE OF THIS INFORMATION AND/OR PROGRAMS DESCRIBED IS AT YOUR OWN RISK.
ANY EASYLANGUAGE OR POWERLANGUAGE TRADING STRATEGIES, SIGNALS, STUDIES, INDICATORS, SHOWME STUDIES, PAINTBAR STUDIES, PROBABILITYMAP STUDIES, ACTIVITYBAR STUDIES, FUNCTIONS (AND PARTS THEREOF) AND ASSOCIATED TECHNIQUES REFERRED TO, INCLUDED IN OR ATTACHED TO THIS TUTORIAL OR PROGRAM DESCRIPTION ARE EXAMPLES ONLY, AND HAVE BEEN INCLUDED SOLELY FOR EDUCATIONAL PURPOSES. MARKPLEX CORPORATION. DOES NOT RECOMMEND THAT YOU USE ANY SUCH TRADING STRATEGIES, SIGNALS, STUDIES, INDICATORS, SHOWME STUDIES, PAINTBAR STUDIES, PROBABILITYMAP STUDIES, ACTIVITYBAR STUDIES, FUNCTIONS (OR ANY PARTS THEREOF) OR TECHNIQUES. THE USE OF ANY SUCH TRADING STRATEGIES, SIGNALS, STUDIES, INDICATORS, SHOWME STUDIES, PAINTBAR STUDIES, PROBABILITYMAP STUDIES, ACTIVITYBAR STUDIES, FUNCTIONS AND TECHNIQUES DOES NOT GUARANTEE THAT YOU WILL MAKE PROFITS, INCREASE PROFITS, OR MINIMIZE LOSSES.