
In program 9 I created a a smoothed, low-lag Commodity Channel Index (CCI) TradeStation EasyLanguage indicator. Program 10 takes this program and adds some enhancements as follows:
- Allows user inputs for the color of the CCI line when above the UpperLine input (in this case, it is set to 100), or below the LowerLine input (in this case it is set to -100) and between the lines.
- Sets an alert when the UpperLine and LowerLine lines are crossed.
- In additional to the divergence functionality included in Program 9, program 10 looks for divergence between the two most recent smoothed CCI pivots, and the most recent price pivot and the pivot before the second most recent price pivot. I explain this is the video below.
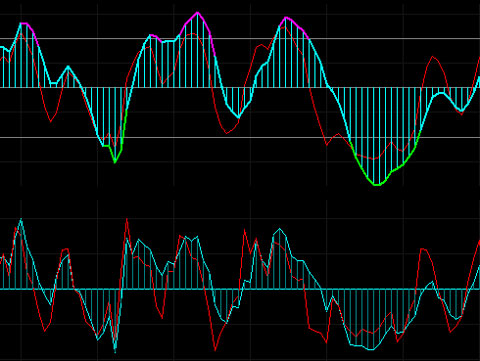
The following images show the Program 10 smoothed Markplex CCI indicator, compared with the CCI indicator supplied with TradeStation.
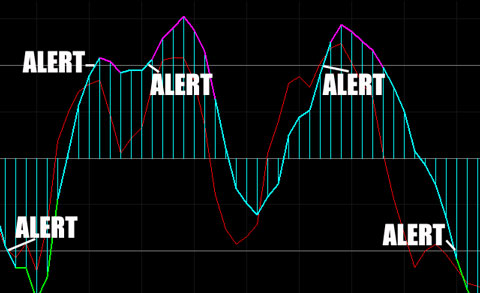
The next image show where alerts are triggered (i,e, each time the smoothed CCI crosses the UpperLine or LowerLine). The “Alert” words were added in PhotoShop in this illustration. The actual alerts use TradeStation functionality via a pop-up notice, audio signal etc.
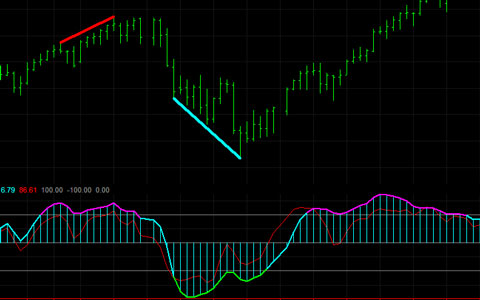
The program also expands the divergence functionality included in program 9. In program nine the indicator looked for ‘matching’ price and smoothed CCI pivots and then looked for divergences. Program 10 maintains this functionality, but now also looks for cases where the smoothed CCI pivot may match the price pivot looked at in Program 9 OR the one before it. ‘Secondary’ divergences are drawn in magenta or cyan. ‘Primary’ divergences are drawn in red or green.
See a video demonstration below.
This UNPROTECTED program (i.e. the TradeStation EasyLanguage indicator) is available for immediate download for $54.95. In addition, if you are a MultiCharts user, a PLA version of the program is also available. Click the following ‘add to cart’ button to pay by credit card or PayPal. Make sure you select the correct version:
The program was developed in TradeStation 8.7 and above and works on intraday, daily, weekly, and monthly charts. The indicator can be applied to tick charts and the CCI plots work correctly. On a tick chart several bars can have the same time signature. This means that the divergence lines may not calculate or draw accurately. Provided you always double check possible divergences, the tool may still be useful on tick chart analysis.
See the video below for more information.
User inputs
ShowLines1( TRUE ), // If TRUE draws lines to illustrate potential divergences
ShowLines2( TRUE ), // If TRUE draws lines to illustrate potential ‘secondary’ divergences
LowerLine( -100 ), // Used to draw horizontal line at the user input level
UpperLine( 100 ), // Used to draw horizontal line at the user input level
LowerColor( Green ), // Color of plot when smoothed CCI goes below LowerLine
UpperColor( Magenta ), // Color of plot when smoothed CCI goes above UpperLine
CCIFastColor( Red ), // Color of fast smoothed CCI
SmoothCCIColor( Cyan ), // Color of smoothed CCI
CCIColor( DarkGray ), // If ‘legacy’ CCI drawn, specify its color
ShowRegularCCI( FALSE ), // If TRUE ‘legacy’ CCI drawn
HorizLines( DarkGray ), // Color of horizontal lines
CCILength( 14 ), // CCI length
FastLength( 6 ), // Length of ‘fast’ CCI
SmoothLength( 14 ), // Factor used to smooth CCI
FastSmoothLength( 14 ), // Factor used to smooth fast CCI
Length ( 20 ), // Lookback length when looking for pivots (used to find divergences)
LeftStrength( 3 ), // Left strength of pivots
RightStrength( 1 ), //Right strength of pivots
BarTol( 3 ), // The number of bars within which the price and CCI pivot must occur for the pivots to be considered to have occurred at the same time
PriceL( Low ), // Price used to find low pivots
PriceH( High ); // Price used to find high pivots
TO THE BEST OF MARKPLEX CORPORATION’S KNOWLEDGE, ALL OF THE INFORMATION ON THIS PAGE IS CORRECT, AND IT IS PROVIDED IN THE HOPE THAT IT WILL BE USEFUL. HOWEVER, MARKPLEX CORPORATION ASSUMES NO LIABILITY FOR ANY DAMAGES, DIRECT OR OTHERWISE, RESULTING FROM THE USE OF THIS INFORMATION AND/OR PROGRAM(S) DESCRIBED, AND NO WARRANTY IS MADE REGARDING ITS ACCURACY OR COMPLETENESS. USE OF THIS INFORMATION AND/OR PROGRAMS DESCRIBED IS AT YOUR OWN RISK.
ANY EASYLANGUAGE OR POWERLANGUAGE TRADING STRATEGIES, SIGNALS, STUDIES, INDICATORS, SHOWME STUDIES, PAINTBAR STUDIES, PROBABILITYMAP STUDIES, ACTIVITYBAR STUDIES, FUNCTIONS (AND PARTS THEREOF) AND ASSOCIATED TECHNIQUES REFERRED TO, INCLUDED IN OR ATTACHED TO THIS TUTORIAL OR PROGRAM DESCRIPTION ARE EXAMPLES ONLY, AND HAVE BEEN INCLUDED SOLELY FOR EDUCATIONAL PURPOSES. MARKPLEX CORPORATION. DOES NOT RECOMMEND THAT YOU USE ANY SUCH TRADING STRATEGIES, SIGNALS, STUDIES, INDICATORS, SHOWME STUDIES, PAINTBAR STUDIES, PROBABILITYMAP STUDIES, ACTIVITYBAR STUDIES, FUNCTIONS (OR ANY PARTS THEREOF) OR TECHNIQUES. THE USE OF ANY SUCH TRADING STRATEGIES, SIGNALS, STUDIES, INDICATORS, SHOWME STUDIES, PAINTBAR STUDIES, PROBABILITYMAP STUDIES, ACTIVITYBAR STUDIES, FUNCTIONS AND TECHNIQUES DOES NOT GUARANTEE THAT YOU WILL MAKE PROFITS, INCREASE PROFITS, OR MINIMIZE LOSSES.
This UNPROTECTED program (i.e. the TradeStation EasyLanguage indicator) is available for immediate download for $54.95. In addition, if you are a MultiCharts user, a PLA version of the program is also available. Click the following ‘add to cart’ button to pay by credit card or PayPal. Make sure you select the correct version:
The program was developed in Tradestation 8.7 and above and works on intraday, daily, weekly, and monthly charts.
To install and use in MultiCharts, download the program and save it to your disk, then open the MultiCharts PowerLanguage Editor and click File then Import , select the file (_Program10.pla), click ok. You should then be able to insert the study on to a chart in MultiCharts.
Video demonstration of Program 10
Please email any bugs that you may discover to support@markplex.com.
TO THE BEST OF MARKPLEX CORPORATION’S KNOWLEDGE, ALL OF THE INFORMATION ON THIS PAGE IS CORRECT, AND IT IS PROVIDED IN THE HOPE THAT IT WILL BE USEFUL. HOWEVER, MARKPLEX CORPORATION ASSUMES NO LIABILITY FOR ANY DAMAGES, DIRECT OR OTHERWISE, RESULTING FROM THE USE OF THIS INFORMATION AND/OR PROGRAM(S) DESCRIBED, AND NO WARRANTY IS MADE REGARDING ITS ACCURACY OR COMPLETENESS. USE OF THIS INFORMATION AND/OR PROGRAMS DESCRIBED IS AT YOUR OWN RISK.
ANY EASYLANGUAGE OR POWERLANGUAGE TRADING STRATEGIES, SIGNALS, STUDIES, INDICATORS, SHOWME STUDIES, PAINTBAR STUDIES, PROBABILITYMAP STUDIES, ACTIVITYBAR STUDIES, FUNCTIONS (AND PARTS THEREOF) AND ASSOCIATED TECHNIQUES REFERRED TO, INCLUDED IN OR ATTACHED TO THIS TUTORIAL OR PROGRAM DESCRIPTION ARE EXAMPLES ONLY, AND HAVE BEEN INCLUDED SOLELY FOR EDUCATIONAL PURPOSES. MARKPLEX CORPORATION. DOES NOT RECOMMEND THAT YOU USE ANY SUCH TRADING STRATEGIES, SIGNALS, STUDIES, INDICATORS, SHOWME STUDIES, PAINTBAR STUDIES, PROBABILITYMAP STUDIES, ACTIVITYBAR STUDIES, FUNCTIONS (OR ANY PARTS THEREOF) OR TECHNIQUES. THE USE OF ANY SUCH TRADING STRATEGIES, SIGNALS, STUDIES, INDICATORS, SHOWME STUDIES, PAINTBAR STUDIES, PROBABILITYMAP STUDIES, ACTIVITYBAR STUDIES, FUNCTIONS AND TECHNIQUES DOES NOT GUARANTEE THAT YOU WILL MAKE PROFITS, INCREASE PROFITS, OR MINIMIZE LOSSES.