
Programs 9 and 10 are smoothed, low-lag Commodity Channel Index (CCI) TradeStation EasyLanguage indicators. Program 11 takes these programs and adds additional enhancements as follows:
- A new input that allows users to look for divergences between price and the smoothed fast CCI
- Programs 9 and 10 ensure that the confirming pivot bar is complete before drawing the divergence line on the chart. A new user input allows the user the option of drawing a line when there is a possible divergence. The line would then disappear if the divergence. were not confirmed when the bar closes.
- A new input allows user the ability to look for potential divergences consisting of two CCI pivots, an initial price pivot and then a price occurring on the same bar as the second CCI pivot that indicates a possible divergence. The second price ‘sampling’ does not necessarily need to be a price pivot. The idea is that it could possibly give the user early warning of a divergence, prior to the price pivot occurring
I explain these new features in the video below.
The following images show the Program 11 smoothed Markplex CCI indicator, compared with the CCI indicator supplied with TradeStation.
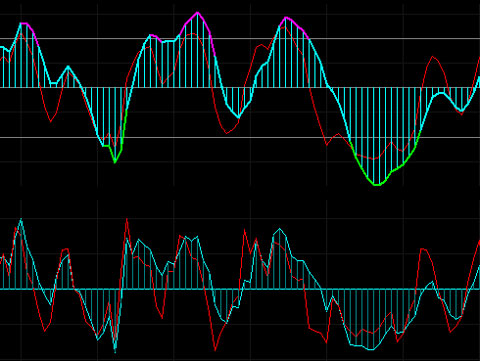
As with program 10, program 11 now also looks for cases where the smoothed CCI pivot may match the price pivot looked at in Program 9 OR the one before it. ‘Secondary’ divergences, as I refer to them here, are drawn in magenta or cyan. ‘Primary’ divergences are drawn in red or green. See below for a comprehensive color key.
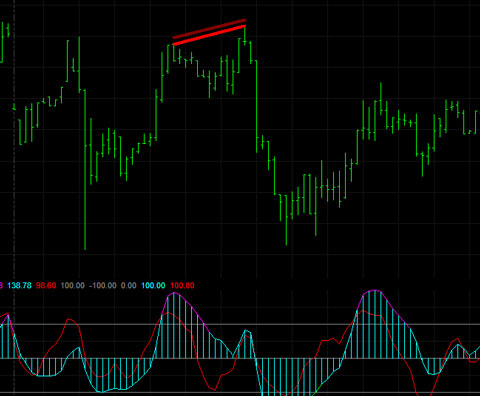
The program adds a new feature enabling the user to modify a user input to look for divergences between price and the smoothed fast CCI. This is illustrated in the image below where divergence between price and the smoothed CCI and price and the smoothed fast CCI, occur on the same bar. Notice the two lines, one red and the other dark red. The dark red line shows potential divergence between price and the smoothed, fast CCI.
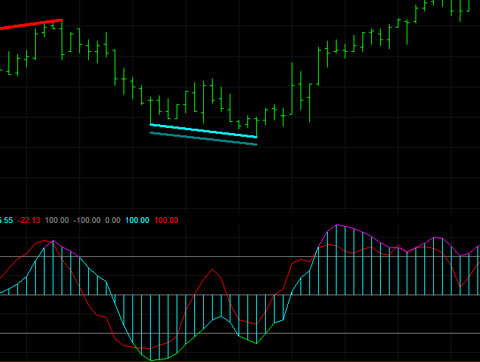
The following image gives an example, of what I have described as ‘secondary’ divergence.’ Notice an intervening low price pivot in price between the two price pivots. This is ignored and hence we show a ‘secondary’ divergence in cyan and dark cyan.
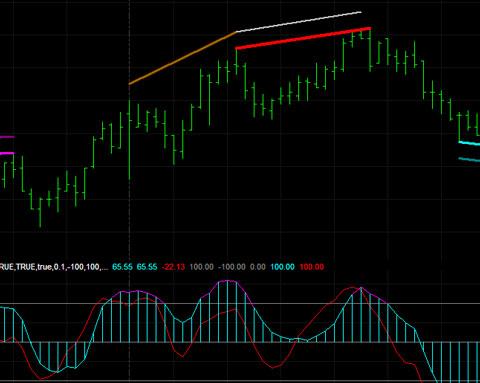
In the following image the ‘fast divergence’ input is set to TRUE. This feature looks for divergences between two CCI pivots, a first price pivot and then the price that occurs on the same bar as the second CCI pivot. The lines are drawn in light gray, dark gray or brown (see color code below). Notice how the right hand end of the light gray line is drawn one bar to the left of the red line – i.e. it is not waiting for the second price pivot to be confirmed.
Plots
Plot1 = Regular CCI
Plot2 = Smoothed CCI
Plot3 = Smoothed CCI (for plotting as histogram)
Plot4 = Smoothed Fast CCI
Plot5 = ‘OverBought’ horizontal line
Plot6 = ‘OverSold’ horizontal line
Plot7 = Zero horizontal line
in addition:
Plot 8 = Plots 100 when low divergence occurs
Plot9 = Plots 100 when high divergence occurs
See a video demonstration below.
Bear in mind that this indicator is a tool and consequently you will likely need to adjust the various inputs to obtain potentially useful information. It is also worth noting that it is still important to carefully look at the chart to ensure that potential divergences really exist. You would also need to find confirming signals or indicators prior to trading.
This PROTECTED program (i.e. the TradeStation EasyLanguage indicator) is available for immediate download for $69.95. If you are a MultiCharts user, a ‘read only’ SEF version of the program is available. Click on the ‘add to cart’ button to pay using a credit card or PayPal
Bonus TradeStation Scanner video
If you buy the TradeStation version, I will also send you a link to a video that explains how you could use this program to scan a universe of stocks to see which ones the indicator has found possible divergence for using TradeStation Scanner.
This PROTECTED program (i.e. the TradeStation EasyLanguage indicator) is available for immediate download for $69.95. If you are a MultiCharts user, a ‘read only’ SEF version of the program is available. Click on the ‘add to cart’ button to pay using a credit card or PayPal
If you have already downloaded program 9 and/or 10, and are interested in this program, please email martyn.whittaker@markplex.com and I will forward you a special $29.95 ‘upgrade’ link.
The program was developed in TradeStation 8.7 and works on intraday, daily, weekly, and monthly charts. The indicator can also be applied to tick charts and the CCI plots work correctly, however, on a tick chart several bars can have the same time signature, this means that the divergence lines may not calculate or draw accurately. Provided you always double check possible divergences, the tool may still be useful on tick chart analysis.
See the video below for more information.
User inputs
SmoothCCIFastDiv( TRUE ), // If TRUE also draws divergences between price and SmoothCCIFast
EarlyWarning( TRUE ), // If FALSE waits until end of bar to draw divergence, otherwise it draws line if divergence condition in place during bar formation
OnePricePivDiv( FALSE ), // If TRUE looks for 2 pivots in CCI and only the first one in price
ShowLines1( TRUE ), // If TRUE draws lines to illustrate potential divergences
ShowLines2( TRUE ), // If TRUE draws lines to illustrate potential ‘secondary’ divergences
LineSeparator( MinMove / PriceScale ), // Determines vertically how far apart certain divergence. lines are drawn
LowerLine( -100 ), // Used to draw horizontal line at the user input level
UpperLine( 100 ), // Used to draw horizontal line at the user input level
LowerColor( Green ),
UpperColor( Magenta ),
CCIFastColor( Red ), // Color of fast smoothed CCI
SmoothCCIColor( Cyan ), // Color of smoothed CCI
CCIColor( DarkGray ), // If ‘legacy’ CCI drawn, specify its color
ShowRegularCCI( FALSE ), // If TRUE ‘legacy’ CCI drawn
HorizLines( DarkGray ), // Color of horizontal lines
CCILength( 14 ), // CCI length
FastLength( 6 ), // Length of ‘fast’ CCI
SmoothLength( 14 ), // Factor used to smooth CCI
FastSmoothLength( 14 ), // Factor used to smooth fast CCI
Length ( 20 ), // Lookback length when looking for pivots (used to find divergences)
LeftStrength( 3 ), // Left strength of pivots
RightStrength( 1 ), //Right strength of pivots
BarTol( 3 ), // The number of bars within which the price and CCI pivot must occur for the pivots to be considered to have occurred at the same time
PriceL( Low ), // Price used to find low pivots
PriceH( High ); // Price used to find high pivots
Divergence color Key
The colors below refer to the lines drawn on the price chart.
Low price pivots are based on the PriceL input. High price pivots are based on the PriceH input.
The key to ‘position’ in the table below is as follows:
O = Drawn between the high or low price pivots, depending on the type of divergence. For example, divergence between two low price pivots and two low smoothed CCI pivots would be drawn between the two low price pivots.
A = Drawn above the high or low pivots by a user specified amount (LineSeparator), depending on the type of divergence. For example, divergence between two high price pivots and two high smoothed CCI pivots would be drawn between the two low price pivots plus the amount specified in LineSeparator. If OnePricePivDiv is set to TRUE the line is drawn between the first pivot plus the amount specified in the LineSeparator input and the price on the bar where the second CCI pivot occurs plus the amount specified in the LineSeparator input.
B = Drawn below the high or low pivots by a user specified amount (LineSeparator), depending on the type of divergence. For example, divergence between two low price pivots and two low smoothed CCI pivots would be drawn between the two low price pivots less the amount specified in LineSeparator. If OnePricePivDiv is set to TRUE the line is drawn between the first pivot less the amount specified in the LineSeparator input and the price on the bar where the second CCI pivot occurs less the amount specified in the LineSeparator input.
| DESCRIPTION | COLOR | POSITION |
| Price low pivot divergence between two low price pivots and two low smoothed CCI pivots | GREEN | O |
| Price low pivot divergence between two low price pivots and two low smoothed FAST CCI pivots | DARK GREEN | B |
| Price high pivot divergence between two high price pivots and two high smoothed CCI pivots | RED | O |
| Price high pivot divergence between two high price pivots and two high smoothed FAST CCI pivots | DARK RED | A |
| ‘Secondary’ price low pivot divergence between two low price pivots (the most recent and the second most recent) and two low smoothed CCI pivots | CYAN | O |
| ‘Secondary’ price low pivot divergence between two low price pivots (the most recent and the second most recent) and two low smoothed FAST CCI pivots | DARK CYAN | B |
| ‘Secondary’ price high pivot divergence between two high price pivots (the most recent and the second most recent) and two high smoothed CCI pivots | MAGENTA | O |
| ‘Secondary’ price high pivot divergence between two high price pivots (the most recent and the second most recent) and two high smoothed FAST CCI pivots | DARK MAGENTA | A |
| OnePricePivDiv set to TRUE. Price low pivot divergence between two low smoothed CCI pivots, one low price pivot and the price that occurred at the most recent CCI pivot | LIGHT GRAY | B |
| OnePricePivDiv set to TRUE. Price low pivot divergence between two low smoothed FAST CCI pivots, one low price pivot and the price that occurred at the most recent FAST CCI pivot | DARK GRAY | B |
| OnePricePivDiv set to TRUE. Price high pivot divergence between two high smoothed CCI pivots, one high price pivot and the high price that occurred at the most recent CCI pivot | LIGHT GRAY | A |
| OnePricePivDiv set to TRUE. Price high pivot divergence between two high smoothed FAST CCI pivots, one high price pivot and the high price that occurred at the most recentFAST CCI pivot | DARK GRAY | A |
| SECONDARY DIVERGENCE. OnePricePivDiv set to TRUE. Price low pivot divergence between two low smoothed CCI pivots, one low price pivot (the second most recent) and the price that occurred at the most recent CCI pivot | DARK BROWN | B |
| SECONDARY DIVERGENCE. OnePricePivDiv set to TRUE. Price low pivot divergence between two low smoothed FAST CCI pivots, one low price pivot (the second most recent) and the price that occurred at the most recent FAST CCI pivot | DARK BROWN | B |
| SECONDARY DIVERGENCE. OnePricePivDiv set to TRUE. Price high pivot divergence between two high smoothed CCI pivots, one high price pivot (the second most recent) and the price that occurred at the most recent high CCI pivot | DARK BROWN | A |
| SECONDARY DIVERGENCE. OnePricePivDiv set to TRUE. Price high pivot divergence between two high smoothed FAST CCI pivots, one high price pivot (the second most recent) and the price that occurred at the most recent high FAST CCI pivot | DARK BROWN | A |
TO THE BEST OF MARKPLEX CORPORATION’S KNOWLEDGE, ALL OF THE INFORMATION ON THIS PAGE IS CORRECT, AND IT IS PROVIDED IN THE HOPE THAT IT WILL BE USEFUL. HOWEVER, MARKPLEX CORPORATION ASSUMES NO LIABILITY FOR ANY DAMAGES, DIRECT OR OTHERWISE, RESULTING FROM THE USE OF THIS INFORMATION AND/OR PROGRAM(S) DESCRIBED, AND NO WARRANTY IS MADE REGARDING ITS ACCURACY OR COMPLETENESS. USE OF THIS INFORMATION AND/OR PROGRAMS DESCRIBED IS AT YOUR OWN RISK.
ANY EASYLANGUAGE OR POWERLANGUAGE TRADING STRATEGIES, SIGNALS, STUDIES, INDICATORS, SHOWME STUDIES, PAINTBAR STUDIES, PROBABILITYMAP STUDIES, ACTIVITYBAR STUDIES, FUNCTIONS (AND PARTS THEREOF) AND ASSOCIATED TECHNIQUES REFERRED TO, INCLUDED IN OR ATTACHED TO THIS TUTORIAL OR PROGRAM DESCRIPTION ARE EXAMPLES ONLY, AND HAVE BEEN INCLUDED SOLELY FOR EDUCATIONAL PURPOSES. MARKPLEX CORPORATION. DOES NOT RECOMMEND THAT YOU USE ANY SUCH TRADING STRATEGIES, SIGNALS, STUDIES, INDICATORS, SHOWME STUDIES, PAINTBAR STUDIES, PROBABILITYMAP STUDIES, ACTIVITYBAR STUDIES, FUNCTIONS (OR ANY PARTS THEREOF) OR TECHNIQUES. THE USE OF ANY SUCH TRADING STRATEGIES, SIGNALS, STUDIES, INDICATORS, SHOWME STUDIES, PAINTBAR STUDIES, PROBABILITYMAP STUDIES, ACTIVITYBAR STUDIES, FUNCTIONS AND TECHNIQUES DOES NOT GUARANTEE THAT YOU WILL MAKE PROFITS, INCREASE PROFITS, OR MINIMIZE LOSSES.
This PROTECTED program (i.e. the TradeStation EasyLanguage indicator) is available for immediate download for $69.95. If you are a MultiCharts user, a ‘read only’ SEF version of the program is available. Click on the ‘add to cart’ button to pay using a credit card or PayPal
The program was developed in TradeStation 8.7 and works on intraday, daily, weekly, and monthly charts.
To install and use in MultiCharts, download the program and save it to your disk, then open the MultiCharts PowerLanguage Editor and click File then Import Read-Only, select the file (_program9.sef), click ok. You should then be able to insert the study on to a chart in MultiCharts.
The program is ‘protected,’ (or ‘read-only’ in the case of the MultiCharts version) in other words, you will not be able to see and edit the source code, but you will be able to apply it to a chart and modify the inputs.
Video demonstration of Program 11
The program is ‘protected,’ (or ‘read-only’ in the case of the MultiCharts version) in other words, you will not be able to see and edit the source code, but you will be able to apply it to a chart and modify the inputs.
The TradeStation version of the program may be used with the TradeStation Scanner. I demonstrate this in the following video.
Please email any bugs that you may discover to support@markplex.com.
TO THE BEST OF MARKPLEX CORPORATION’S KNOWLEDGE, ALL OF THE INFORMATION ON THIS PAGE IS CORRECT, AND IT IS PROVIDED IN THE HOPE THAT IT WILL BE USEFUL. HOWEVER, MARKPLEX CORPORATION ASSUMES NO LIABILITY FOR ANY DAMAGES, DIRECT OR OTHERWISE, RESULTING FROM THE USE OF THIS INFORMATION AND/OR PROGRAM(S) DESCRIBED, AND NO WARRANTY IS MADE REGARDING ITS ACCURACY OR COMPLETENESS. USE OF THIS INFORMATION AND/OR PROGRAMS DESCRIBED IS AT YOUR OWN RISK.
ANY EASYLANGUAGE OR POWERLANGUAGE TRADING STRATEGIES, SIGNALS, STUDIES, INDICATORS, SHOWME STUDIES, PAINTBAR STUDIES, PROBABILITYMAP STUDIES, ACTIVITYBAR STUDIES, FUNCTIONS (AND PARTS THEREOF) AND ASSOCIATED TECHNIQUES REFERRED TO, INCLUDED IN OR ATTACHED TO THIS TUTORIAL OR PROGRAM DESCRIPTION ARE EXAMPLES ONLY, AND HAVE BEEN INCLUDED SOLELY FOR EDUCATIONAL PURPOSES. MARKPLEX CORPORATION. DOES NOT RECOMMEND THAT YOU USE ANY SUCH TRADING STRATEGIES, SIGNALS, STUDIES, INDICATORS, SHOWME STUDIES, PAINTBAR STUDIES, PROBABILITYMAP STUDIES, ACTIVITYBAR STUDIES, FUNCTIONS (OR ANY PARTS THEREOF) OR TECHNIQUES. THE USE OF ANY SUCH TRADING STRATEGIES, SIGNALS, STUDIES, INDICATORS, SHOWME STUDIES, PAINTBAR STUDIES, PROBABILITYMAP STUDIES, ACTIVITYBAR STUDIES, FUNCTIONS AND TECHNIQUES DOES NOT GUARANTEE THAT YOU WILL MAKE PROFITS, INCREASE PROFITS, OR MINIMIZE LOSSES.