
Update September 9, 2011: Based on a client request, I have added an additional piece of functionality to this program such that at the beginning of the current day, the program prints out the top time zone values based on the TimeLinesToShow input. See below for more information.
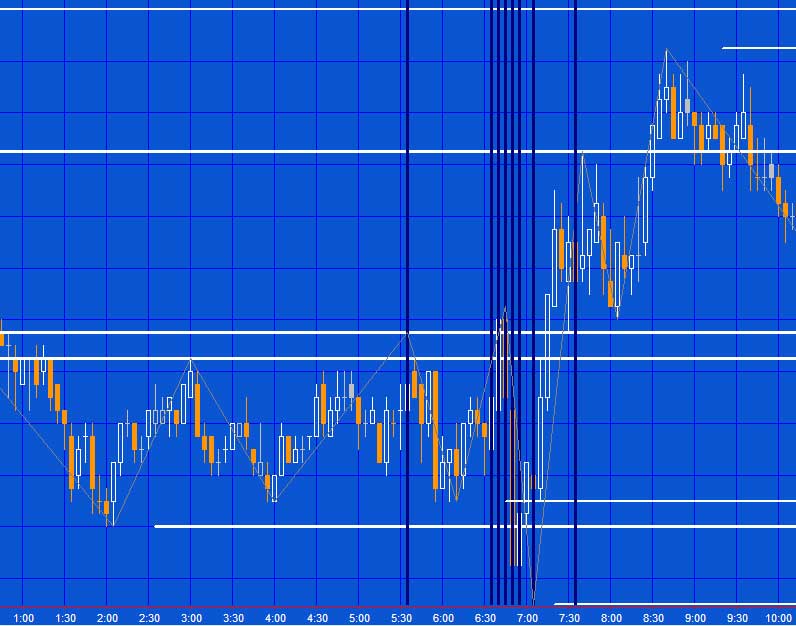
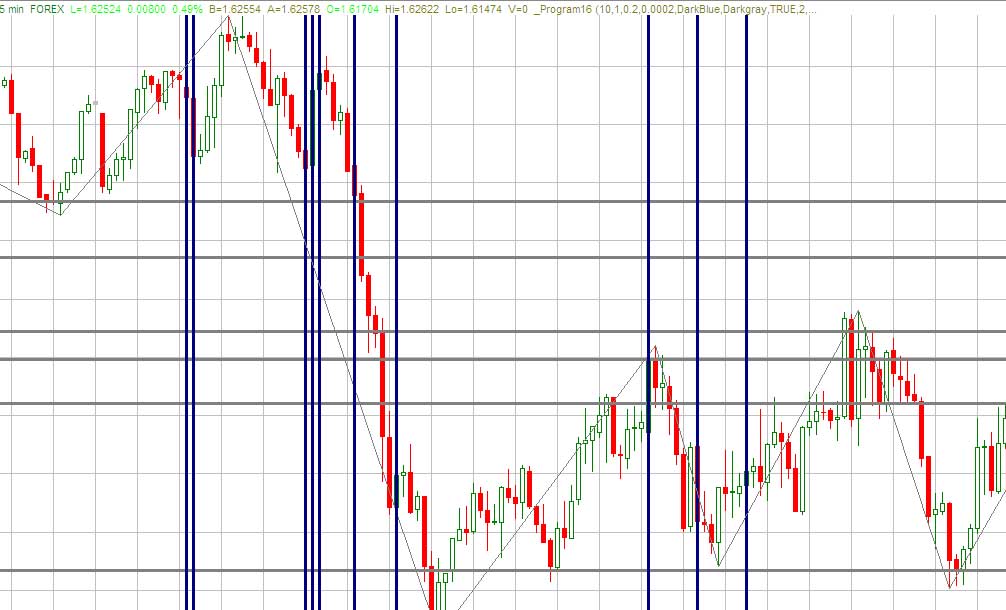
Program 16 is an unprotected TradeStation EasyLanguage show me study which analyzes price action in terms of both time and potential support and resistance levels on intraday charts. It attempts to find ‘zones’ where, historically, significant price turning points have occurred. The idea behind the program is that if turning points occur at specific times or levels previously, then, perhaps, they will occur at these times and/or levels again.
 I have included several example screen grabs below of the program applied to futures, forex and stocks.
After you apply the program to a chart, adjusting the inputs determine what you will see. If you decide to download the program I have included a link to a special video that demonstrates how you could go about change the inputs. The link may be found in the program ‘source code’
The program works by searching for turning points using a zig-zag pattern. It stores the prices and times at which these turning points occur in an array and then analyzes the data to show both the times and price levels at which these significant turning points have occurred most often in the past. It also shows the zig zag pattern if the user input ShowZigZag is set to true.
Download the program here for $74.95.
This price includes an array sorting function and a link to the supplementary video. The program works in TradeStation versions 8.7, 8.8, 9.0 9.5 and 10.0.
The video below describes these features in more detail.
THE SHOW ME STUDY HAS BEEN INCLUDED SOLELY FOR EDUCATIONAL PURPOSES.
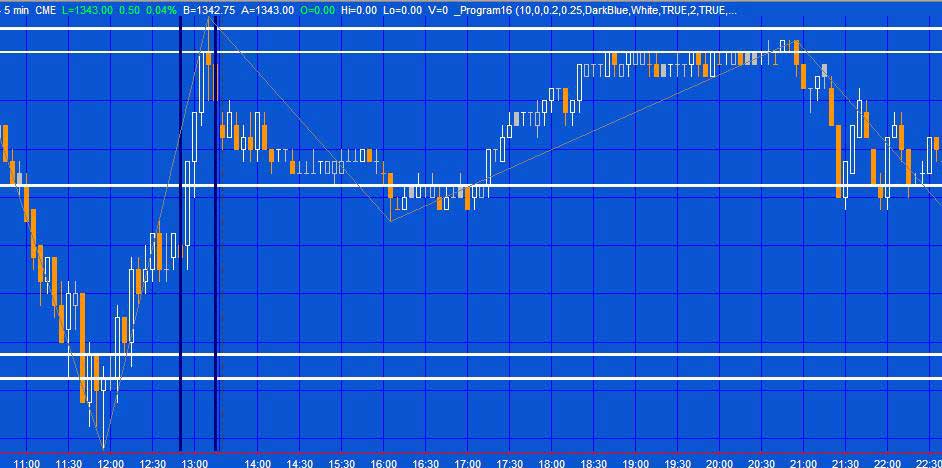
Program 16 applied to a 5 minute @ES chart.
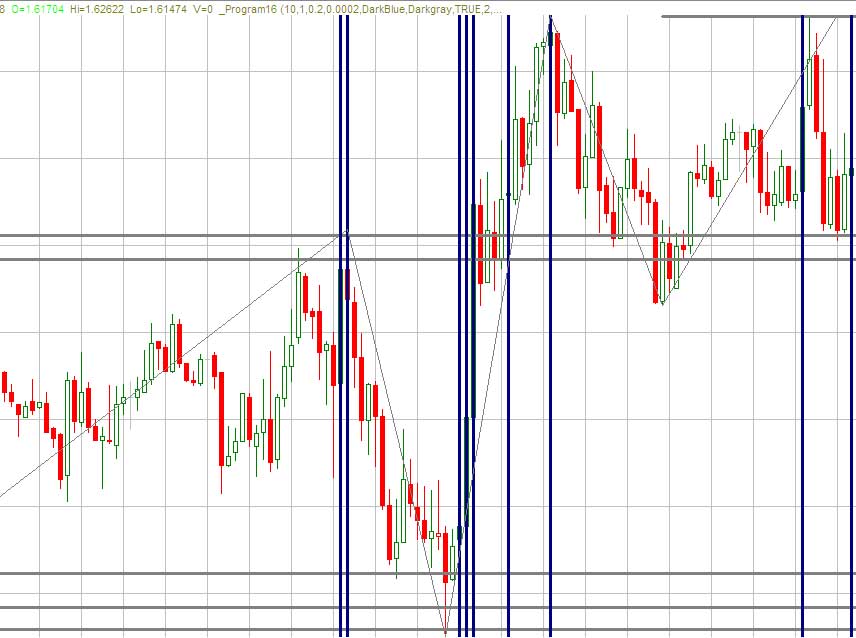
Program 16 applied to a 5 minute GBPUSD chart.
User Inputs
TimeLinesToShow( 10 ), // Number of combined time lines to show
LevelLinesFilter( 10 ), // Weighting must be greater than this value
PivotTune( 0.2 ), // Used To determine The strength of The turning points
CombineVal( 1 * MinMove / PriceScale ), // Numeric value above or below potential support and resistance lines for existing line to be combined
Col( DarkBlue ), // Color of vertical time lines
ColConf( Darkgray ), // Color of horizontal lines
ShowTimeLines( TRUE ), // Determines if times lines are shown
MaxThickness( 2 ), // Maximum thickness of lines (maximum allowed = 6)
ShowZigZag( TRUE ), // Set to TRUE to see the zig zag lines
ZigZagCol( DarkGray ), // Color of zig zag line
TurboMode( True ), // Only plot lines today
PrintTimes( True ); // If TRUE times are printed for currentdate
Program 16 applied to a 5 minute GBPUSD chart.
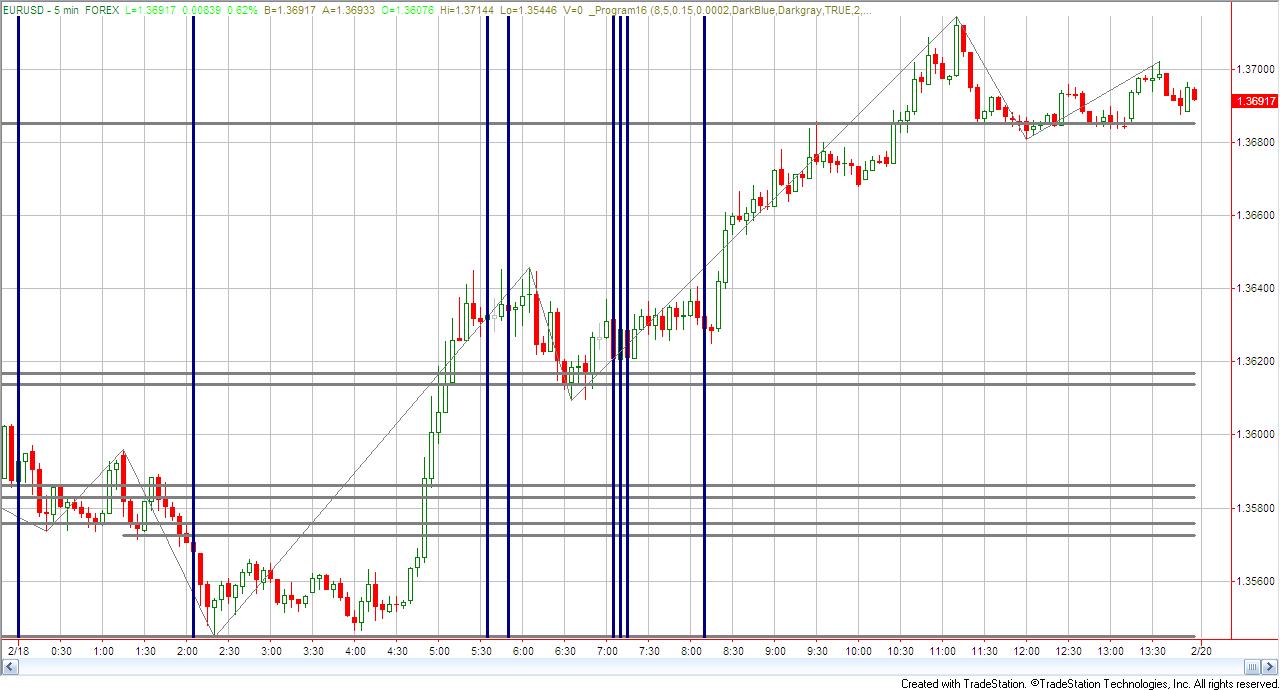
Program 16 applied to a 5 minute EURUSD chart.
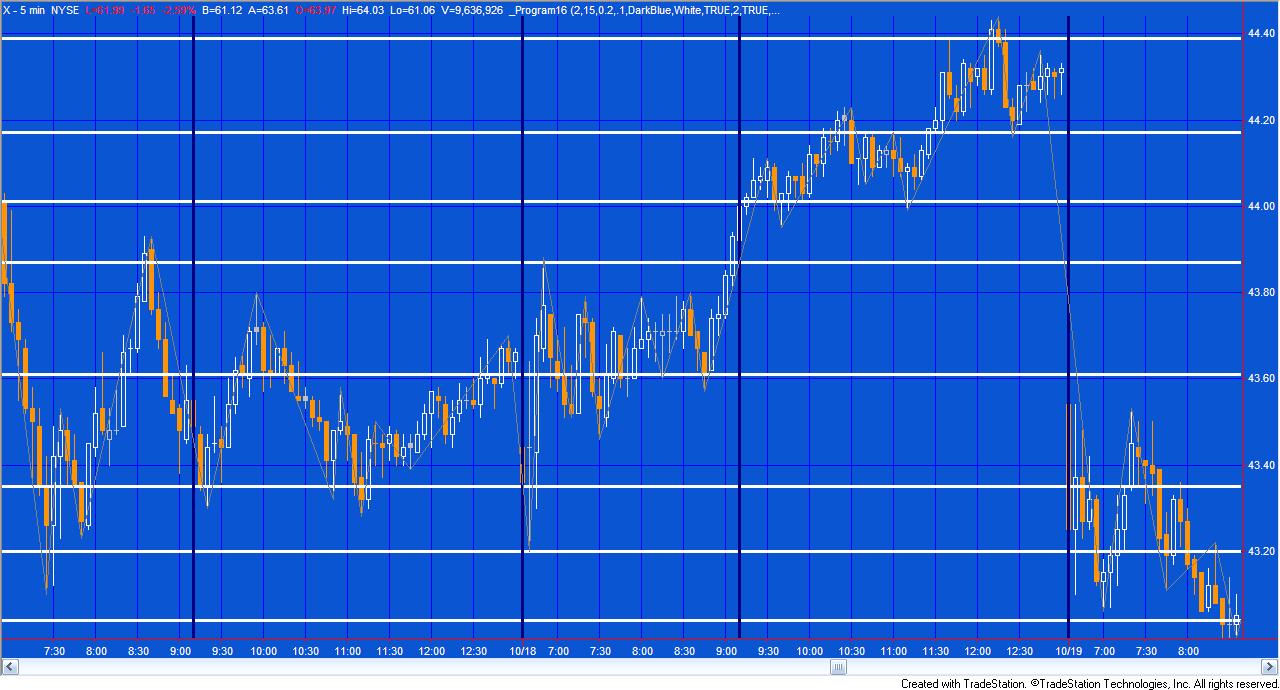
Program 16 applied to a 5 minute U.S. Steel Corporation chart.
Program 16 applied to a 5 minute Google chart.
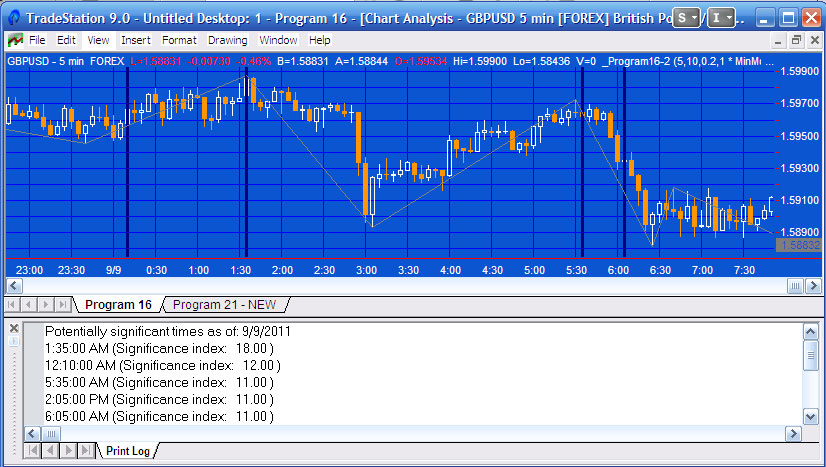
Program 16 showing the time ‘zone’ values printed at the start of the new day
See a video demonstration below.
TO THE BEST OF MARKPLEX CORPORATION’S KNOWLEDGE, ALL OF THE INFORMATION ON THIS PAGE IS CORRECT, AND IT IS PROVIDED IN THE HOPE THAT IT WILL BE USEFUL. HOWEVER, MARKPLEX CORPORATION ASSUMES NO LIABILITY FOR ANY DAMAGES, DIRECT OR OTHERWISE, RESULTING FROM THE USE OF THIS INFORMATION AND/OR PROGRAM(S) DESCRIBED, AND NO WARRANTY IS MADE REGARDING ITS ACCURACY OR COMPLETENESS. USE OF THIS INFORMATION AND/OR PROGRAMS DESCRIBED IS AT YOUR OWN RISK.
ANY EASYLANGUAGE OR POWERLANGUAGE TRADING STRATEGIES, SIGNALS, STUDIES, INDICATORS, SHOWME STUDIES, PAINTBAR STUDIES, PROBABILITYMAP STUDIES, ACTIVITYBAR STUDIES, FUNCTIONS (AND PARTS THEREOF) AND ASSOCIATED TECHNIQUES REFERRED TO, INCLUDED IN OR ATTACHED TO THIS TUTORIAL OR PROGRAM DESCRIPTION ARE EXAMPLES ONLY, AND HAVE BEEN INCLUDED SOLELY FOR EDUCATIONAL PURPOSES. MARKPLEX CORPORATION. DOES NOT RECOMMEND THAT YOU USE ANY SUCH TRADING STRATEGIES, SIGNALS, STUDIES, INDICATORS, SHOWME STUDIES, PAINTBAR STUDIES, PROBABILITYMAP STUDIES, ACTIVITYBAR STUDIES, FUNCTIONS (OR ANY PARTS THEREOF) OR TECHNIQUES. THE USE OF ANY SUCH TRADING STRATEGIES, SIGNALS, STUDIES, INDICATORS, SHOWME STUDIES, PAINTBAR STUDIES, PROBABILITYMAP STUDIES, ACTIVITYBAR STUDIES, FUNCTIONS AND TECHNIQUES DOES NOT GUARANTEE THAT YOU WILL MAKE PROFITS, INCREASE PROFITS, OR MINIMIZE LOSSES.
Download the program here for $74.95.
YOU MAY PAY BY CREDIT CARD OR PAYPAL. YOU DO NOT NEED TO HAVE OR OPEN A PAYPAL ACCOUNT TO MAKE A PAYMENT. This price includes the function to sort arrays.
See the video below for more information.
TO THE BEST OF MARKPLEX CORPORATION’S KNOWLEDGE, ALL OF THE INFORMATION ON THIS PAGE IS CORRECT, AND IT IS PROVIDED IN THE HOPE THAT IT WILL BE USEFUL. HOWEVER, MARKPLEX CORPORATION ASSUMES NO LIABILITY FOR ANY DAMAGES, DIRECT OR OTHERWISE, RESULTING FROM THE USE OF THIS INFORMATION AND/OR PROGRAM(S) DESCRIBED, AND NO WARRANTY IS MADE REGARDING ITS ACCURACY OR COMPLETENESS. USE OF THIS INFORMATION AND/OR PROGRAMS DESCRIBED IS AT YOUR OWN RISK.
ANY EASYLANGUAGE OR POWERLANGUAGE TRADING STRATEGIES, SIGNALS, STUDIES, INDICATORS, SHOWME STUDIES, PAINTBAR STUDIES, PROBABILITYMAP STUDIES, ACTIVITYBAR STUDIES, FUNCTIONS (AND PARTS THEREOF) AND ASSOCIATED TECHNIQUES REFERRED TO, INCLUDED IN OR ATTACHED TO THIS TUTORIAL OR PROGRAM DESCRIPTION ARE EXAMPLES ONLY, AND HAVE BEEN INCLUDED SOLELY FOR EDUCATIONAL PURPOSES. MARKPLEX CORPORATION. DOES NOT RECOMMEND THAT YOU USE ANY SUCH TRADING STRATEGIES, SIGNALS, STUDIES, INDICATORS, SHOWME STUDIES, PAINTBAR STUDIES, PROBABILITYMAP STUDIES, ACTIVITYBAR STUDIES, FUNCTIONS (OR ANY PARTS THEREOF) OR TECHNIQUES. THE USE OF ANY SUCH TRADING STRATEGIES, SIGNALS, STUDIES, INDICATORS, SHOWME STUDIES, PAINTBAR STUDIES, PROBABILITYMAP STUDIES, ACTIVITYBAR STUDIES, FUNCTIONS AND TECHNIQUES DOES NOT GUARANTEE THAT YOU WILL MAKE PROFITS, INCREASE PROFITS, OR MINIMIZE LOSSES.
Download the program here for $74.95.
This price includes the function that sorts the array.
The program was developed to work in TradeStation 8.7 (it also works with TradeStation 8.8, 9.0, 9.1, 9.5, and 10.0) and works on intraday charts. It may also be applied to a daily chart, but only the horizontal support and resistance levels are meaningful.
Video Demonstration of Program 16 – Part 1
Video Demonstration of Program 16 – Part 2
Download the program here for $74.95.
If you would prefer to pay be check, please make a check payable to Billy Fire LLC and mail to Billy Fire LLC, 14781 Pomerado Road, #110, Poway CA 92064 together with a valid email address. I will email download instructions to you. This price includes the function that sorts the array.
Please email any bugs that you may discover to support@markplex.com.
TO THE BEST OF MARKPLEX CORPORATION’S KNOWLEDGE, ALL OF THE INFORMATION ON THIS PAGE IS CORRECT, AND IT IS PROVIDED IN THE HOPE THAT IT WILL BE USEFUL. HOWEVER, MARKPLEX CORPORATION ASSUMES NO LIABILITY FOR ANY DAMAGES, DIRECT OR OTHERWISE, RESULTING FROM THE USE OF THIS INFORMATION AND/OR PROGRAM(S) DESCRIBED, AND NO WARRANTY IS MADE REGARDING ITS ACCURACY OR COMPLETENESS. USE OF THIS INFORMATION AND/OR PROGRAMS DESCRIBED IS AT YOUR OWN RISK.
ANY EASYLANGUAGE OR POWERLANGUAGE TRADING STRATEGIES, SIGNALS, STUDIES, INDICATORS, SHOWME STUDIES, PAINTBAR STUDIES, PROBABILITYMAP STUDIES, ACTIVITYBAR STUDIES, FUNCTIONS (AND PARTS THEREOF) AND ASSOCIATED TECHNIQUES REFERRED TO, INCLUDED IN OR ATTACHED TO THIS TUTORIAL OR PROGRAM DESCRIPTION ARE EXAMPLES ONLY, AND HAVE BEEN INCLUDED SOLELY FOR EDUCATIONAL PURPOSES. MARKPLEX CORPORATION. DOES NOT RECOMMEND THAT YOU USE ANY SUCH TRADING STRATEGIES, SIGNALS, STUDIES, INDICATORS, SHOWME STUDIES, PAINTBAR STUDIES, PROBABILITYMAP STUDIES, ACTIVITYBAR STUDIES, FUNCTIONS (OR ANY PARTS THEREOF) OR TECHNIQUES. THE USE OF ANY SUCH TRADING STRATEGIES, SIGNALS, STUDIES, INDICATORS, SHOWME STUDIES, PAINTBAR STUDIES, PROBABILITYMAP STUDIES, ACTIVITYBAR STUDIES, FUNCTIONS AND TECHNIQUES DOES NOT GUARANTEE THAT YOU WILL MAKE PROFITS, INCREASE PROFITS, OR MINIMIZE LOSSES.