
Program 17 is an unprotected TradeStation EasyLanguage Indicator which calculates traders pivots (PP, R1, R2, S1 and S2 levels) using either:
- Classic
- Woodie
- or Camarilla
formulae (see formulae below). The program calculates levels for the entire chart and then analyzes the data to find potential levels where there is a conflux of traders’ pivot levels.
Since some analysts might wish to base traders’ pivot calculations on different time periods, the program also offers the flexibility of defining the period to be considered. This could be a simple stock trading session or a 24 hour session. The program differs from program 2 as it allows you to specify a period start starts one day and ends the next. It also only includes the PP, R1, R2, S1, and S2 levels. Note: if you would like to see the R3, R4, S3 and S4 levels, you may be interested in program 7 – configurable pivot program.
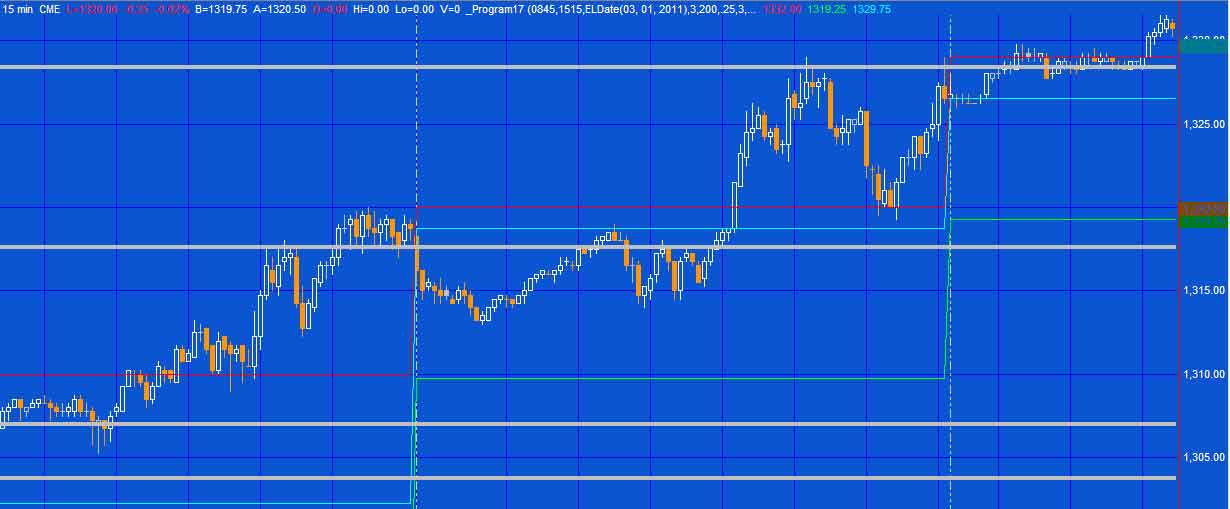
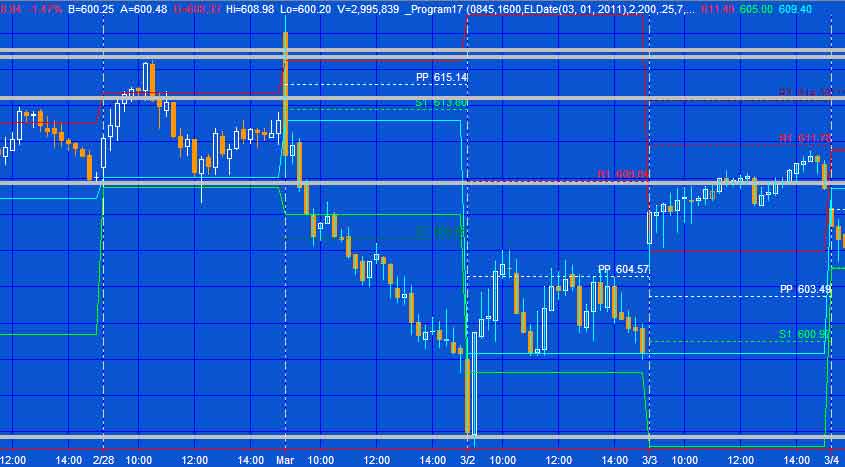
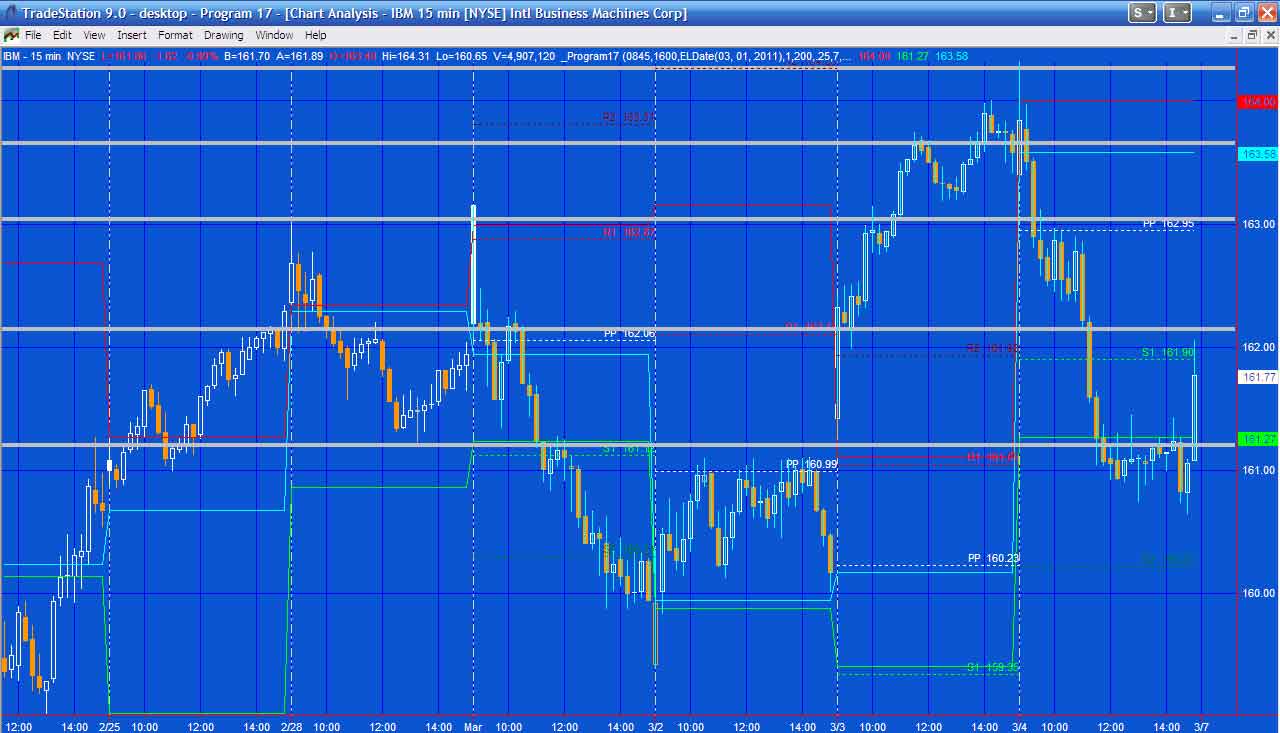
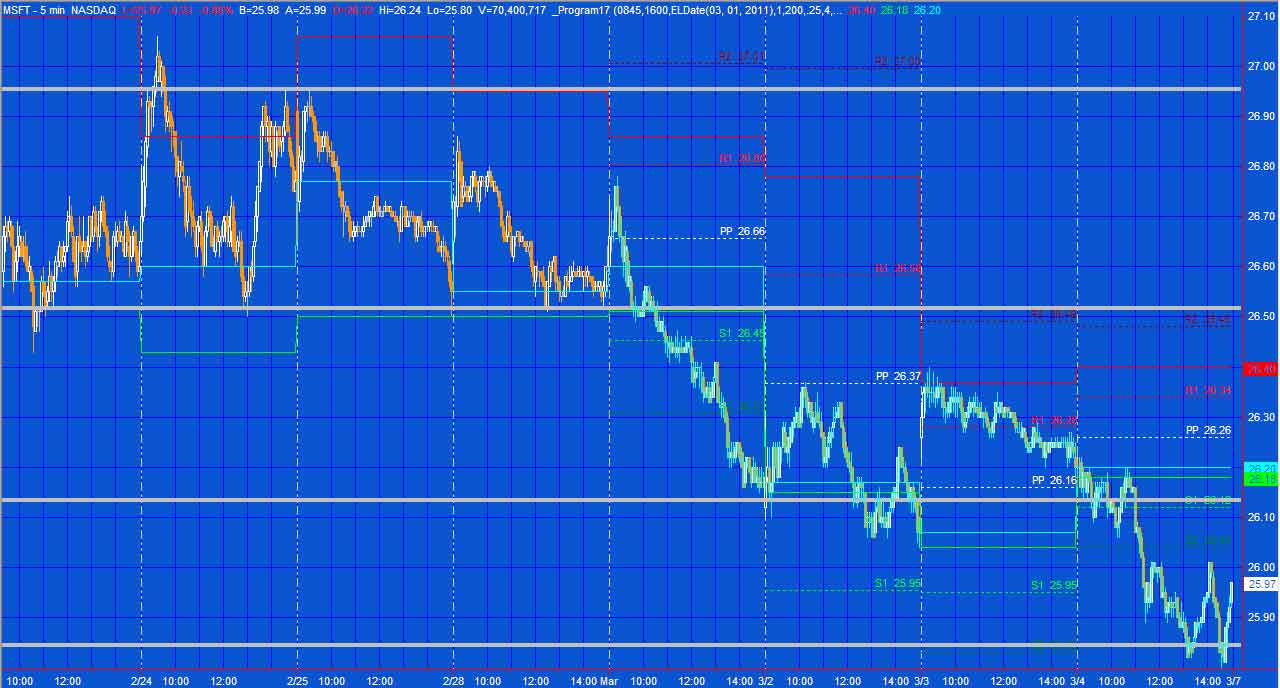
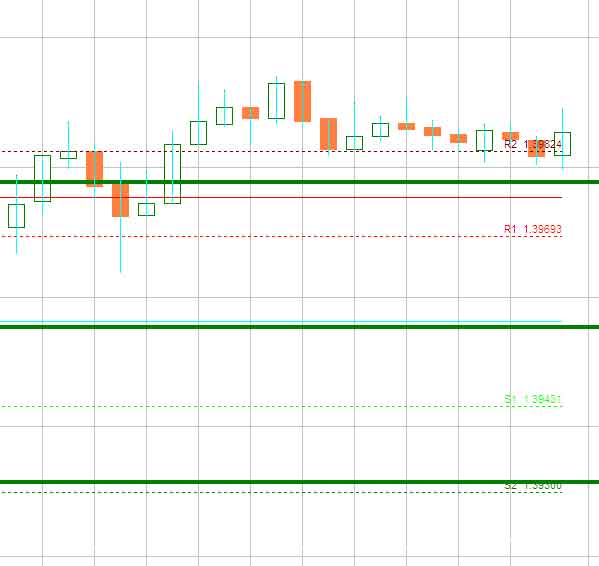
As well as calculating traders’ pivot confluence, the program draws recent traders’ pivot levels for dates equal to or greater than a user specified input. The program also plots the high, low and close of the previous user defined ‘session.’ Other features are demonstrated in the video below.
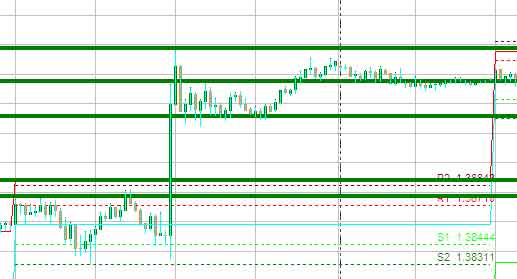 I have included several example screen grabs below of the program applied to various charts.
In order to see a bigger image, simply click on the image you would like to enlarge. Once open, to close the enlarged image, click the cross at the top right hand corner.
This unprotected program (i.e. the TradeStation EasyLanguage indicator) is available for immediate download for an online payment of $74.95 by clicking the following button.
I have included a link to a bonus video which gives some ideas of how to set the program up. The program works in TradeStation versions 8.7, 8.8 and 9.0. I have added several comments in the code which includes several techniques, such as using two-dimensional arrays, creating user defined sessions, and manipulating drawing objects.
THE INDICATOR STUDY HAS BEEN INCLUDED SOLELY FOR EDUCATIONAL PURPOSES.
User Inputs
StartTime( 0900), // Start time of period
EndTime( 1600), // End time of period
// If EndTime > StartTime then same day, if EndTime < StartTime then Starttime is one day, EndTime the next
PivotType( 1), // 1 = Classic, 2 = Woodie, 3 = Camarilla
NumberPivots( 200), // The number of historic traders pivot levels to be included in the array (up to 200)
CombineVal( .25), // Numeric value above or below new traders pivot level to determine whether it can be combined with an existing line
LineSensitivity( 3), // ‘Thickness’ equal to or above this number extended to the right
DatetoStart( ELDate(03, 01, 2011)), // Enter date to start showing traders’ pivots as ELDate(04, 14, 2010) or 1100414
PPcolor( White), // PP color
R1color( Red), // R1 color
R2color( DarkRed), // R2 color
S1color( Green), // S1 color
S2color( DarkGreen), // S2 color
CombineCol( LightGray), // Color of combined lines
ShowHiLoClose( TRUE), // Determines whether indicator lines showing high, low and close of period are drawn
DecPlaces( 2), // The number of decimal places displayed on today’s Pivot levels
TestCalc( FALSE), // If TRUE prints in Print Log high, low, close of period and/or open of period and PP calculation
OutputofInputs( FALSE); // If TRUE prints inputs in Print Log
See a video demonstration below.
Formulae
Pivots are calculated using the following formulae:
Classic
R2 = PP + RANGE
R1 = (2 * PP) – LOW
PP = (HIGH + LOW + CLOSE) / 3
S1 = (2 * PP) – HIGH
S2 = PP – RANGE
Woodie
R2 = PP + RANGE
R1 = (2 * PP) – LOW
PP = PP = (HIGH + LOW + OPEN + OPEN) / 4
S1 = (2 * PP) – HIGH
S2 = PP – RANGE
using OPEN = TODAY’S OPEN, and yesterday’s HIGH and LOW
Camarilla
R2 = C + RANGE * 1.1/6
R1 = C + RANGE * 1.1/12
PP = (HIGH + LOW + CLOSE) / 3
S1 = C – RANGE * 1.1/12
S2 = C – RANGE * 1.1/6
This unprotected program (i.e. the TradeStation EasyLanguage indicator) is available for immediate download for an online payment of $74.95 by clicking the following button.
I have included a link to a bonus video which gives some ideas of how to set the program up. YOU MAY PAY BY CREDIT CARD OR PAYPAL. YOU DO NOT NEED TO HAVE OR OPEN A PAYPAL ACCOUNT TO MAKE A PAYMENT.
See the video below for more information.
TO THE BEST OF MARKPLEX CORPORATION’S KNOWLEDGE, ALL OF THE INFORMATION ON THIS PAGE IS CORRECT, AND IT IS PROVIDED IN THE HOPE THAT IT WILL BE USEFUL. HOWEVER, MARKPLEX CORPORATION ASSUMES NO LIABILITY FOR ANY DAMAGES, DIRECT OR OTHERWISE, RESULTING FROM THE USE OF THIS INFORMATION AND/OR PROGRAM(S) DESCRIBED, AND NO WARRANTY IS MADE REGARDING ITS ACCURACY OR COMPLETENESS. USE OF THIS INFORMATION AND/OR PROGRAMS DESCRIBED IS AT YOUR OWN RISK.
ANY EASYLANGUAGE OR POWERLANGUAGE TRADING STRATEGIES, SIGNALS, STUDIES, INDICATORS, SHOWME STUDIES, PAINTBAR STUDIES, PROBABILITYMAP STUDIES, ACTIVITYBAR STUDIES, FUNCTIONS (AND PARTS THEREOF) AND ASSOCIATED TECHNIQUES REFERRED TO, INCLUDED IN OR ATTACHED TO THIS TUTORIAL OR PROGRAM DESCRIPTION ARE EXAMPLES ONLY, AND HAVE BEEN INCLUDED SOLELY FOR EDUCATIONAL PURPOSES. MARKPLEX CORPORATION. DOES NOT RECOMMEND THAT YOU USE ANY SUCH TRADING STRATEGIES, SIGNALS, STUDIES, INDICATORS, SHOWME STUDIES, PAINTBAR STUDIES, PROBABILITYMAP STUDIES, ACTIVITYBAR STUDIES, FUNCTIONS (OR ANY PARTS THEREOF) OR TECHNIQUES. THE USE OF ANY SUCH TRADING STRATEGIES, SIGNALS, STUDIES, INDICATORS, SHOWME STUDIES, PAINTBAR STUDIES, PROBABILITYMAP STUDIES, ACTIVITYBAR STUDIES, FUNCTIONS AND TECHNIQUES DOES NOT GUARANTEE THAT YOU WILL MAKE PROFITS, INCREASE PROFITS, OR MINIMIZE LOSSES.
This unprotected program (i.e. the TradeStation EasyLanguage indicator) is available for immediate download for an online payment of $74.95 by clicking the following button.
I have included a link to a bonus video which gives some ideas of how to set the program up.
The program was developed to work in TradeStation 8.7 (it also works with TradeStation 8.8, 9.0, 10 and leter versions) and works on intraday charts (minute and tick charts).
Video demonstration of program 17
This unprotected program (i.e. the TradeStation EasyLanguage indicator) is available for immediate download for an online payment of $74.95 by clicking the following button.
I have included a link to a bonus video which gives some ideas of how to set the program up.
Bonus video – program 17 setup
Please email any bugs that you find to support@markplex.com.
TO THE BEST OF MARKPLEX CORPORATION’S KNOWLEDGE, ALL OF THE INFORMATION ON THIS PAGE IS CORRECT, AND IT IS PROVIDED IN THE HOPE THAT IT WILL BE USEFUL. HOWEVER, MARKPLEX CORPORATION ASSUMES NO LIABILITY FOR ANY DAMAGES, DIRECT OR OTHERWISE, RESULTING FROM THE USE OF THIS INFORMATION AND/OR PROGRAM(S) DESCRIBED, AND NO WARRANTY IS MADE REGARDING ITS ACCURACY OR COMPLETENESS. USE OF THIS INFORMATION AND/OR PROGRAMS DESCRIBED IS AT YOUR OWN RISK.
ANY EASYLANGUAGE OR POWERLANGUAGE TRADING STRATEGIES, SIGNALS, STUDIES, INDICATORS, SHOWME STUDIES, PAINTBAR STUDIES, PROBABILITYMAP STUDIES, ACTIVITYBAR STUDIES, FUNCTIONS (AND PARTS THEREOF) AND ASSOCIATED TECHNIQUES REFERRED TO, INCLUDED IN OR ATTACHED TO THIS TUTORIAL OR PROGRAM DESCRIPTION ARE EXAMPLES ONLY, AND HAVE BEEN INCLUDED SOLELY FOR EDUCATIONAL PURPOSES. MARKPLEX CORPORATION. DOES NOT RECOMMEND THAT YOU USE ANY SUCH TRADING STRATEGIES, SIGNALS, STUDIES, INDICATORS, SHOWME STUDIES, PAINTBAR STUDIES, PROBABILITYMAP STUDIES, ACTIVITYBAR STUDIES, FUNCTIONS (OR ANY PARTS THEREOF) OR TECHNIQUES. THE USE OF ANY SUCH TRADING STRATEGIES, SIGNALS, STUDIES, INDICATORS, SHOWME STUDIES, PAINTBAR STUDIES, PROBABILITYMAP STUDIES, ACTIVITYBAR STUDIES, FUNCTIONS AND TECHNIQUES DOES NOT GUARANTEE THAT YOU WILL MAKE PROFITS, INCREASE PROFITS, OR MINIMIZE LOSSES.