
Program 18 consists of an unprotected TradeStation EasyLanguage strategy together with a protected EasyLanguage function and a smoothed CCI indicator. The function calculates the smoothed Markplex CCI (using the calculation previously applied in programs 10 and 11) and it is called from both the strategy and the indicator. The strategy bases signals on divergence between the smoothed CCI and price.The strategy has a number of options based on user inputs, including:
- Whether trades are based on ‘primary’ or ‘secondary’ divergence, or both.
- Whether to use fast smoothed CCI or regular smoothed CCI or both.
- Whether or not to look for a recent price pivot or to look for two CCI pivots and assume price at the second CCI pivot.

The various options are explained in detail in the video below.
The program includes a user input for the number for the contracts bought or sold, together with inputs defining two targets and how many contracts to exit at the first target. The program includes a trailing stop and a user input to define its value.
Like some of our other strategies, the program’s ‘source’ code also includes a section where the user can easily define filters. This section includes an example of a simple stochastic filter.

This unprotected strategy software, unprotected indicator and protected function are available for immediate download for $225- by clicking the following button to pay using Credit Card or PayPal.
The program works in TradeStation versions 8.7, 8.8, 9.0, 9.1, 9.5 and 10. I have commented the code. It has been tested it on intraday, daily, weekly and monthly charts for futures, stocks and forex.
UPDATE: The download now includes MultiCharts export files. As with the TradeStation version, the CCI function is protected. The download includes the following files: PROGRAM18.ELD, _Program18.pla and_Program18-function.sef. If you are a TradeStation user will just need to install PROGRAM18.ELD. If you are a MultiCharts user you will need to install _Program18.pla and_Program18-function.sef. Install _Program18-function.sef BEFORE _Program18.pla.
THE STRATEGY, INDICATOR AND FUNCTION HAVE BEEN INCLUDED SOLELY FOR EDUCATIONAL PURPOSES.
User Inputs
I describe the following user inputs in the video and in more detail below.
- Inputs: Cts( 10), // Number of contracts to be traded
- HiFreq( 0 ), // Allow new divergence signal to reverse trade
- TrailVal( 61), // Trail value – expressed as multiple of minimum price move
- Tgt1( 141), // First target – expressed as multiple of minimum price move (i.e. Target1 = Tgt1 * MinMove / PriceScale)
- Tgt2( 1), // Second target – incremental to the first target (i.e. Target2 = Tgt2 * MinMove / PriceScale + Target1)
- FirstTgtCts( 1), // The number of contracts to be taken off at first target
- ShowLines( false), // If set to TRUE historical target and trailing stop lines are drawn – if false just today’s lines
- SmoothCCIFastDiv( 1), // If 1 – divergences between price and SmoothCCIFast
- OnePricePivDiv( 0), // If equal to 1 looks for 2 pivots in CCI and only the first one in price
- PotenDiv( 0), // If equal to 1 draws lines and creates possible trades based on potential divergences
- Poten2Div( 1), // If equal to 1 draws lines and creates possible trades based on potential ‘secondary’ divergences
- CCILength( 14), // CCI length
- FastLength( 7), // Length of ‘fast’ CCI
- SmoothLength( 12), // Factor used to smooth CCI
- FastSmoothLength( 12), // Factor used to smooth fast CCI
- Length ( 20), // Lookback length when looking for pivots (used to find divergences)
- LeftStrength( 3), // Left strength of pivots
- RightStrength( 1), // Right strength of pivots
- BarTol( 3), // The number of bars within which the price and CCI pivot must occur for the pivots to be considered to have occurred at the same time
- PriceL( Low), // Price used to find low pivots
- PriceH( High), // Price used to find high pivots
- LineSeparator( 0.0003); // Determines vertically how far apart certain divergence lines are drawn
Screen grabs
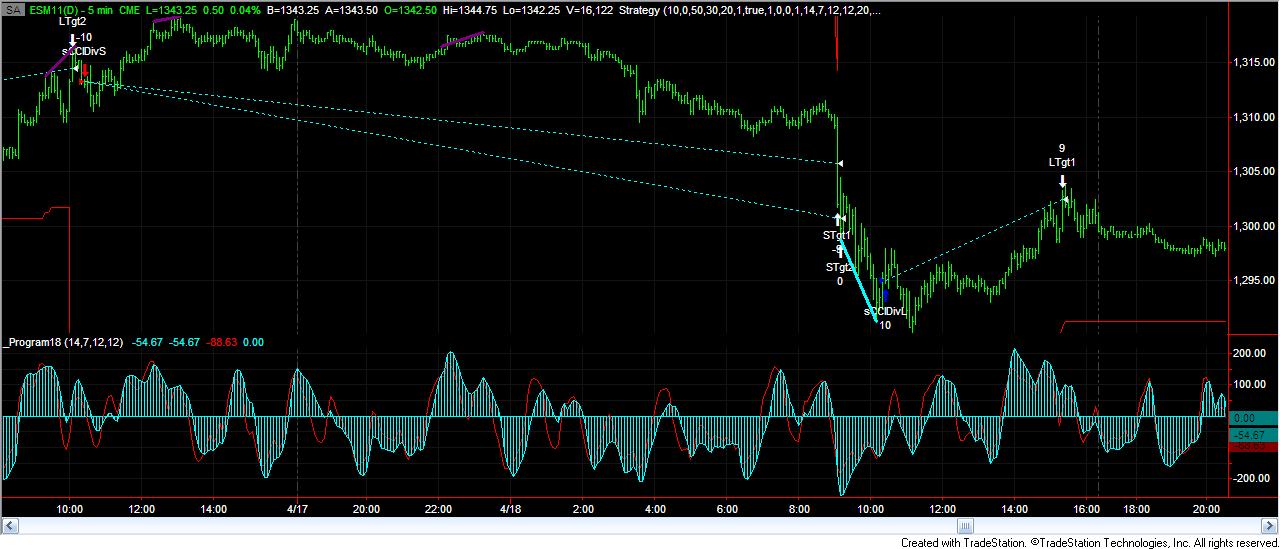
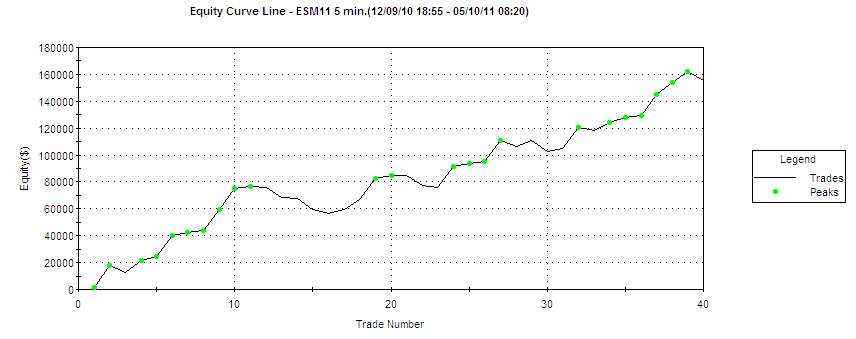
An example back testing report showing the equity graph from the program applied to 5 minute ESM(D) chart based on historical data. Commission set at $2.5 per contract and slippage at $12.5 per contract..
N.B. that any screen shots on this site are examples and are not meant to imply that any of this strategy will generate profitable trades. THIS STRATEGY AND OTHER PROGRAMS DESCRIBED ON THIS SITE HAVE BEEN INCLUDED SOLELY FOR EDUCATIONAL PURPOSES. .
This unprotected strategy software, unprotected indicator and protected function are available for immediate download for $225- by clicking the following button to pay using Credit Card or PayPal.
The program works in TradeStation versions 8.7, 8.8, 9.0, 9.1, 9.5 and 10. I have commented the code. It has been tested it on intraday, daily, weekly and monthly charts for futures, stocks and forex.
UPDATE: The download now includes MultiCharts export files. As with the TradeStation version, the CCI function is protected. The download includes the following files: PROGRAM18.ELD, _Program18.pla and_Program18-function.sef. If you are a TradeStation user will just need to install PROGRAM18.ELD. If you are a MultiCharts user you will need to install _Program18.pla and_Program18-function.sef. Install _Program18-function.sef BEFORE _Program18.pla.
THE STRATEGY, INDICATOR AND FUNCTION HAVE BEEN INCLUDED SOLELY FOR EDUCATIONAL PURPOSES.
Detailed Description
The smoothed CCI is defined using the following inputs:
- CCILength( 14), // CCI length
- FastLength( 7), // Length of ‘fast’ CCI
- SmoothLength( 12), // Factor used to smooth CCI
- FastSmoothLength( 12), // Factor used to smooth fast CCI

CCILength and FastLength are similar to the inputs to the standard TradeStation CCI function. SmoothLength and FastSmoothLength determine how much the CCI is smoothed using the proprietary Markplex CCI function.
Note: If you also apply the Program 18 CCI indicator to the chart, make sure that these inputs are the same for both the indicator and the strategy to remove possible confusion.
PriceL and PriceH are inputs to determine which prices are used to calculate low and high pivots in price. In the example Low was used for the low price and High for high price, although you could use, for example, Close or (Low + High)/2 etc
The following inputs determine how pivots are calculated for both price and the smoothed CCI:
- Length ( 20), // Lookback length when looking for pivots (used to find divergences)
- LeftStrength( 3), // Left strength of pivots
- RightStrength( 1); // Right strength of pivots
Length determines how many bars we look back each time we look for a pivot. LeftStrength determines, for a low pivot, how many bars must be higher than the pivot to the left, or for a high pivot, how many bars are lower then the pivot to the left. RightStrength determines, for a low pivot, how many bars must be higher than the pivot to the right, or for a high pivot, how many bars are lower then the pivot to the right.
BarTol( 3), // The number of bars within which the price and CCI pivot must occur for the pivots to be considered to have occurred at the same time
Pivots in price and pivots in the CCI don’t necessarily occur on the same bar. BarTol is an input to determine how many bars apart the two occur for them still be be considered as occurring simultaneously as far a divergence detection is concerned.

The following two inputs affect chart presentation:
ShowLines( false), // If set to TRUE historical trailing stop lines are drawn – if false just today’s lines
LineSeparator( 0.0003); // Determines vertically how far apart certain divergence lines are drawn
If ShowLines is set to TRUE historical trailing stops are shown by a red line drawn on the chart. If set to FALSE the lines are only drawn for the current date.
LineSeparator allows some divergence lines to be separated from price action (see Divergence Color Key section below for more detail).
The following inputs determine how many contracts are bought or sold in the initial trade. They also define what the trailing stop is. For a long trade it is initially equal to entry price less TrailVal multiplied by the minimum price move of the instrument being analyzed, it then trails price if price increases. For a short trade is initially equal to entry price plus TrailVal multiplied by the minimum price move of the instrument being analyzed, it then trails price if price decreases.
Tgt1 and Tgt2 determine the targets. For a long trade the first target is equal to entry price plus Tgt1 * MinMove / PriceScale. The second target ( for a long trade) is equal to the first target plus Tgt2 * MinMove / PriceScale.
FirstTgtCts determines how many contracts are taken off at the first target. The remainder are closed at the second target.
- Cts( 10), // Number of contracts to be traded
- TrailVal( 61), // Trail value – expressed as multiple of minimum price move
- Tgt1( 141), // First target – expressed as multiple of minimum price move (i.e. Target1 = Tgt1 * MinMove / PriceScale)
- Tgt2( 1), // Second target – incremental to the first target (i.e. Target2 = Tgt2 * MinMove / PriceScale + Target1)
- FirstTgtCts( 1), // The number of contracts to be taken off at first target
The remaining inputs control the key functionality of how the program operates.
- HiFreq( 0 ), // Allow new divergence signal to reverse trade
- SmoothCCIFastDiv( 1), // If 1 – divergences between price and SmoothCCIFast
- OnePricePivDiv( 0), // If equal to 1 looks for 2 pivots in CCI and only the first one in price
- PotenDiv( 0), // If equal to 1 draws lines and creates possible trades based on potential divergences
- Poten2Div( 1), // If equal to 1 draws lines and creates possible trades based on potential ‘secondary’ divergences
If HiFreq is not set to zero, long trades are not instigated if the program is short and short trades are not instigated if the program is long. This means that the program does not reverse based on divergence signals unless it is flat. If set to 1 the program will reverse on divergence signals and hence it generates a higher volume of trades.
If SmoothCCIFastDiv is set to 1, the program searches for divergence between the fast smoothed CCI AS WELL as the regular CCI.
If OnePricePivDiv is set to zero, the program will not indicate divergences unless there are both 2 CCI pivots and 2 price pivots. If OnePricePivDiv is set to 1, the program only requires 2 CCI pivots and the first price pivot.
If PotenDiv is equal to 1 draws lines and creates possible trades based on potential divergences between corresponding price pivots and CCI pivots (subject to the BarTol input.
If Poten2Div is equal to 1 draws lines and creates possible trades based on potential ‘secondary’ divergences. In this program this is defined as divergence between the most recent price pivot and CCI pivot and the third most recent price pivot and the second most recent CCI pivot.
See a video demonstration below.
This unprotected strategy software, unprotected indicator and protected function are available for immediate download for $225- by clicking the following button to pay using Credit Card or PayPal.
It has been tested it on intraday, daily, weekly and monthly charts for futures, stocks and forex. YOU MAY PAY BY CREDIT CARD OR PAYPAL. YOU DO NOT NEED TO HAVE OR OPEN A PAYPAL ACCOUNT TO MAKE A PAYMENT.
UPDATE: The download now includes MultiCharts export files. As with the TradeStation version, the CCI function is protected. The download includes the following files: PROGRAM18.ELD, _Program18.pla and_Program18-function.sef. If you are a TradeStation user will just need to install PROGRAM18.ELD. If you are a MultiCharts user you will need to install _Program18.pla and_Program18-function.sef. Install _Program18-function.sef BEFORE _Program18.pla.

See the video below for more information.
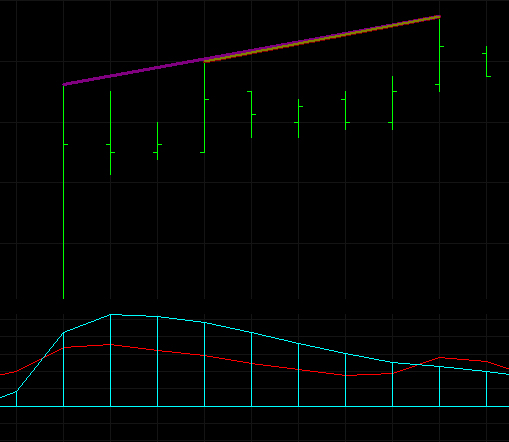
Divergence Color Key
The colors below refer to the lines drawn on the price chart.
The key to ‘position’ of the divergence line on the chart is as follows (see table below):
O = Drawn between the high or low price pivots, depending on the type of divergence. For example, divergence between two low price pivots and two low smoothed CCI pivots would be drawn between the two low price pivots.
A = Drawn above the high or low pivots by a user specified amount (LineSeparator), depending on the type of divergence. For example, divergence between two high price pivots and two high smoothed CCI pivots would be drawn between the two low price pivots plus the amount specified in LineSeparator. If OnePricePivDiv is set to TRUE the line is drawn between the first pivot plus the amount specified in the LineSeparator input and the price on the bar where the second CCI pivot occurs plus the amount specified in the LineSeparator input.
B = Drawn below the high or low pivots by a user specified amount (LineSeparator), depending on the type of divergence. For example, divergence between two low price pivots and two low smoothed CCI pivots would be drawn between the two low price pivots less the amount specified in LineSeparator. If OnePricePivDiv is set to TRUE the line is drawn between the first pivot less the amount specified in the LineSeparator input and the price on the bar where the second CCI pivot occurs less the amount specified in the LineSeparator input.
DESCRIPTION |
COLOR |
POSITION |
| Price low pivot divergence between two low price pivots and two low smoothed CCI pivots | GREEN | O |
| Price low pivot divergence between two low price pivots and two low smoothed FAST CCI pivots | DARK GREEN | B |
| Price high pivot divergence between two high price pivots and two high smoothed CCI pivots | RED | O |
| Price high pivot divergence between two high price pivots and two high smoothed FAST CCI pivots | DARK RED | A |
| ‘Secondary’ price low pivot divergence between two low price pivots (the most recent and the second most recent) and two low smoothed CCI pivots | CYAN | O |
| ‘Secondary’ price low pivot divergence between two low price pivots (the most recent and the second most recent) and two low smoothed FAST CCI pivots | DARK CYAN | B |
| ‘Secondary’ price high pivot divergence between two high price pivots (the most recent and the second most recent) and two high smoothed CCI pivots | MAGENTA | O |
| ‘Secondary’ price high pivot divergence between two high price pivots (the most recent and the second most recent) and two high smoothed FAST CCI pivots | DARK MAGENTA | A |
| OnePricePivDiv set to TRUE. Price low pivot divergence between two low smoothed CCI pivots, one low price pivot and the price that occurred at the most recent CCI pivot | LIGHT GRAY | B |
| OnePricePivDiv set to TRUE. Price low pivot divergence between two low smoothed FAST CCI pivots, one low price pivot and the price that occurred at the most recent FAST CCI pivot | DARK GRAY | B |
| OnePricePivDiv set to TRUE. Price high pivot divergence between two high smoothed CCI pivots, one high price pivot and the high price that occurred at the most recent CCI pivot | LIGHT GRAY | A |
| OnePricePivDiv set to TRUE. Price high pivot divergence between two high smoothed FAST CCI pivots, one high price pivot and the high price that occurred at the most recent FAST CCI pivot | DARK GRAY | A |
| SECONDARY DIVERGENCE. OnePricePivDiv set to TRUE. Price low pivot divergence between two low smoothed CCI pivots, one low price pivot (the second most recent) and the price that occurred at the most recent CCI pivot | DARK BROWN | B |
| SECONDARY DIVERGENCE. OnePricePivDiv set to TRUE. Price low pivot divergence between two low smoothed FAST CCI pivots, one low price pivot (the second most recent) and the price that occurred at the most recent FAST CCI pivot | DARK BROWN | B |
| SECONDARY DIVERGENCE. OnePricePivDiv set to TRUE. Price high pivot divergence between two high smoothed CCI pivots, one high price pivot (the second most recent) and the price that occurred at the most recent high CCI pivot | DARK BROWN | A |
| SECONDARY DIVERGENCE. OnePricePivDiv set to TRUE. Price high pivot divergence between two high smoothed FAST CCI pivots, one high price pivot (the second most recent) and the price that occurred at the most recent high FAST CCI pivot | DARK BROWN | A |
TO THE BEST OF MARKPLEX CORPORATION’S KNOWLEDGE, ALL OF THE INFORMATION ON THIS PAGE IS CORRECT, AND IT IS PROVIDED IN THE HOPE THAT IT WILL BE USEFUL. HOWEVER, MARKPLEX CORPORATION ASSUMES NO LIABILITY FOR ANY DAMAGES, DIRECT OR OTHERWISE, RESULTING FROM THE USE OF THIS INFORMATION AND/OR PROGRAM(S) DESCRIBED, AND NO WARRANTY IS MADE REGARDING ITS ACCURACY OR COMPLETENESS. USE OF THIS INFORMATION AND/OR PROGRAMS DESCRIBED IS AT YOUR OWN RISK.
ANY EASYLANGUAGE OR POWERLANGUAGE TRADING STRATEGIES, SIGNALS, STUDIES, INDICATORS, SHOWME STUDIES, PAINTBAR STUDIES, PROBABILITYMAP STUDIES, ACTIVITYBAR STUDIES, FUNCTIONS (AND PARTS THEREOF) AND ASSOCIATED TECHNIQUES REFERRED TO, INCLUDED IN OR ATTACHED TO THIS TUTORIAL OR PROGRAM DESCRIPTION ARE EXAMPLES ONLY, AND HAVE BEEN INCLUDED SOLELY FOR EDUCATIONAL PURPOSES. MARKPLEX CORPORATION. DOES NOT RECOMMEND THAT YOU USE ANY SUCH TRADING STRATEGIES, SIGNALS, STUDIES, INDICATORS, SHOWME STUDIES, PAINTBAR STUDIES, PROBABILITYMAP STUDIES, ACTIVITYBAR STUDIES, FUNCTIONS (OR ANY PARTS THEREOF) OR TECHNIQUES. THE USE OF ANY SUCH TRADING STRATEGIES, SIGNALS, STUDIES, INDICATORS, SHOWME STUDIES, PAINTBAR STUDIES, PROBABILITYMAP STUDIES, ACTIVITYBAR STUDIES, FUNCTIONS AND TECHNIQUES DOES NOT GUARANTEE THAT YOU WILL MAKE PROFITS, INCREASE PROFITS, OR MINIMIZE LOSSES.
This unprotected strategy software, unprotected indicator and protected function are available for immediate download for $225- by clicking the following button to pay using Credit Card or PayPal.
The program works in TradeStation versions 8.7, 8.8, 9.0, 9.1, 9.5 and 10. It has been tested it on intraday, daily, weekly and monthly charts for futures, stocks and forex.
UPDATE: The download now includes MultiCharts export files. As with the TradeStation version, the CCI function is protected. The download includes the following files: PROGRAM18.ELD, _Program18.pla and_Program18-function.sef. If you are a TradeStation user will just need to install PROGRAM18.ELD. If you are a MultiCharts user you will need to install _Program18.pla and_Program18-function.sef. Install _Program18-function.sef BEFORE _Program18.pla.
THE STRATEGY, INDICATOR AND FUNCTION HAVE BEEN INCLUDED SOLELY FOR EDUCATIONAL PURPOSES.
Video demonstration of Program 18
This unprotected strategy software, unprotected indicator and protected function are available for immediate download for $225- by clicking the following button to pay using Credit Card or PayPal.
It has been tested it on intraday, daily, weekly and monthly charts for futures, stocks and forex.
UPDATE: The download now includes MultiCharts export files. As with the TradeStation version, the CCI function is protected. The download includes the following files: PROGRAM18.ELD, _Program18.pla and_Program18-function.sef. If you are a TradeStation user will just need to install PROGRAM18.ELD. If you are a MultiCharts user you will need to install _Program18.pla and_Program18-function.sef. Install _Program18-function.sef BEFORE _Program18.pla.
If you would prefer to pay be check, please make a check payable to Billy Fire LLC and mail to Billy Fire LLC, 14781 Pomerado Road, #110, Poway CA 92064 together with a valid email address. I will email download instructions to you.
Please email any bugs that you may discover to support@markplex.com.
TO THE BEST OF MARKPLEX CORPORATION’S KNOWLEDGE, ALL OF THE INFORMATION ON THIS PAGE IS CORRECT, AND IT IS PROVIDED IN THE HOPE THAT IT WILL BE USEFUL. HOWEVER, MARKPLEX CORPORATION ASSUMES NO LIABILITY FOR ANY DAMAGES, DIRECT OR OTHERWISE, RESULTING FROM THE USE OF THIS INFORMATION AND/OR PROGRAM(S) DESCRIBED, AND NO WARRANTY IS MADE REGARDING ITS ACCURACY OR COMPLETENESS. USE OF THIS INFORMATION AND/OR PROGRAMS DESCRIBED IS AT YOUR OWN RISK.
ANY EASYLANGUAGE OR POWERLANGUAGE TRADING STRATEGIES, SIGNALS, STUDIES, INDICATORS, SHOWME STUDIES, PAINTBAR STUDIES, PROBABILITYMAP STUDIES, ACTIVITYBAR STUDIES, FUNCTIONS (AND PARTS THEREOF) AND ASSOCIATED TECHNIQUES REFERRED TO, INCLUDED IN OR ATTACHED TO THIS TUTORIAL OR PROGRAM DESCRIPTION ARE EXAMPLES ONLY, AND HAVE BEEN INCLUDED SOLELY FOR EDUCATIONAL PURPOSES. MARKPLEX CORPORATION. DOES NOT RECOMMEND THAT YOU USE ANY SUCH TRADING STRATEGIES, SIGNALS, STUDIES, INDICATORS, SHOWME STUDIES, PAINTBAR STUDIES, PROBABILITYMAP STUDIES, ACTIVITYBAR STUDIES, FUNCTIONS (OR ANY PARTS THEREOF) OR TECHNIQUES. THE USE OF ANY SUCH TRADING STRATEGIES, SIGNALS, STUDIES, INDICATORS, SHOWME STUDIES, PAINTBAR STUDIES, PROBABILITYMAP STUDIES, ACTIVITYBAR STUDIES, FUNCTIONS AND TECHNIQUES DOES NOT GUARANTEE THAT YOU WILL MAKE PROFITS, INCREASE PROFITS, OR MINIMIZE LOSSES.