
Updates
Program 21 Ver. 3.0 | Turning Point Finder is a TradeStation EasyLanguage ShowMe study designed to find turning points in price action on a chart. It is based on the original Program 21 which was available on the TradeStation strategy network/app store, but is now exclusively available as a download (see below).
The new version of the program includes two additional inputs which are described below and provide greater control over the function of the program. I have left the original video on this page as it still adds value, although it does not include a description of the two new inputs. I have included a new video that includes a discussion of the new features included in the program.
The program is unprotected so that you can modify it, adapt it and, hopefully, improve it.
Functionality
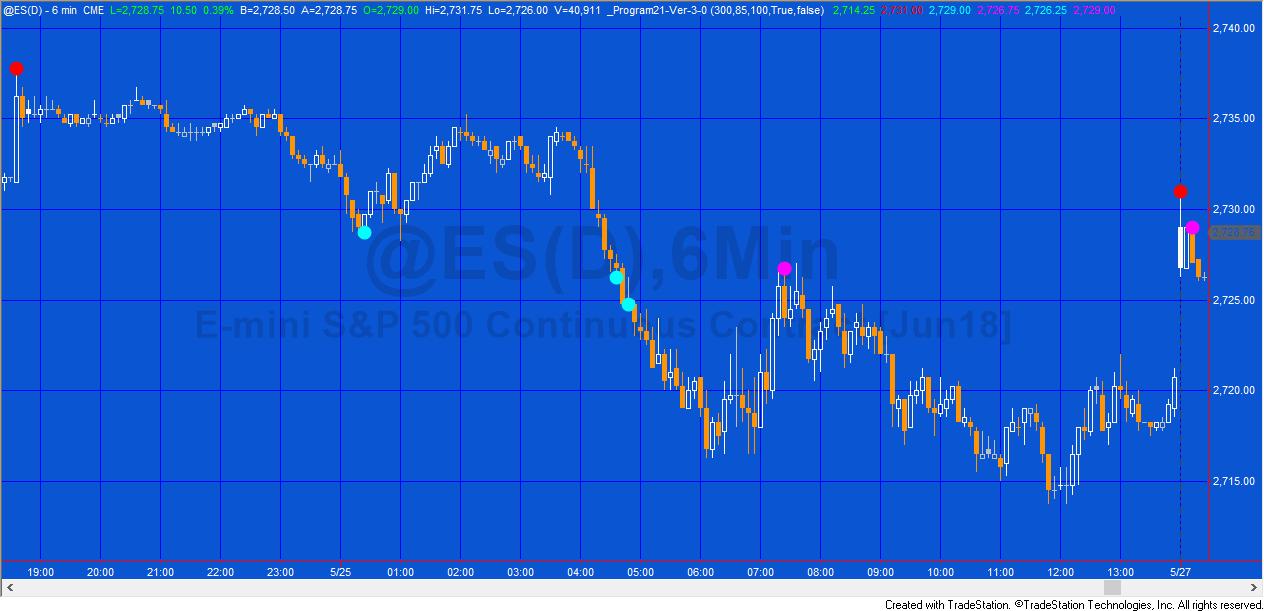
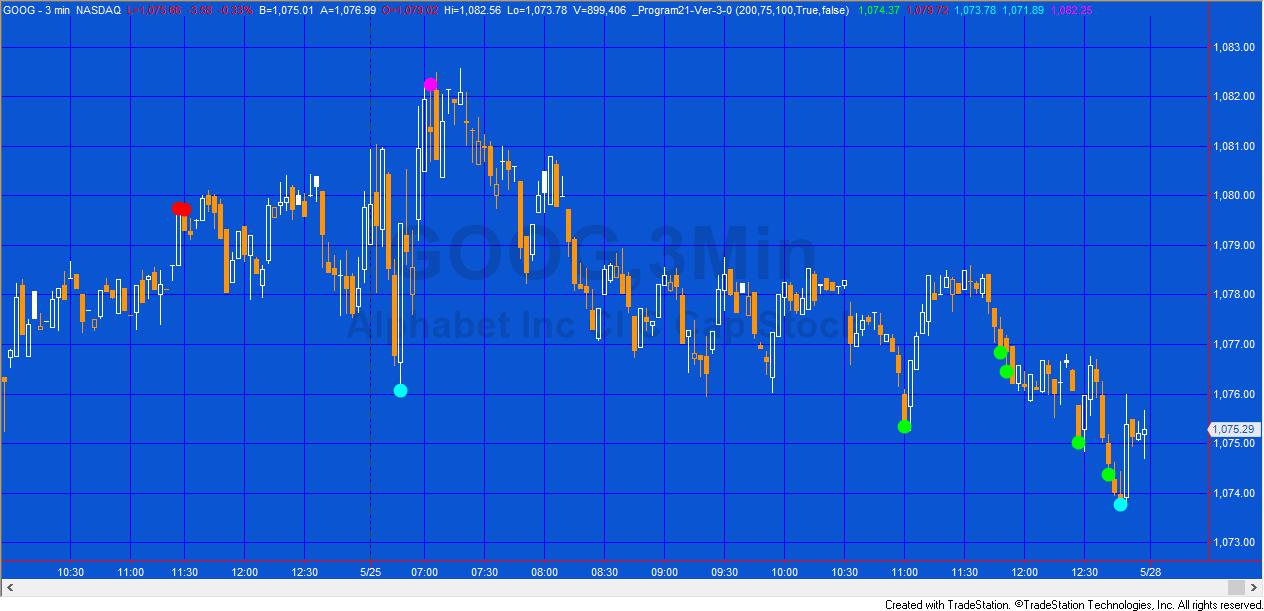
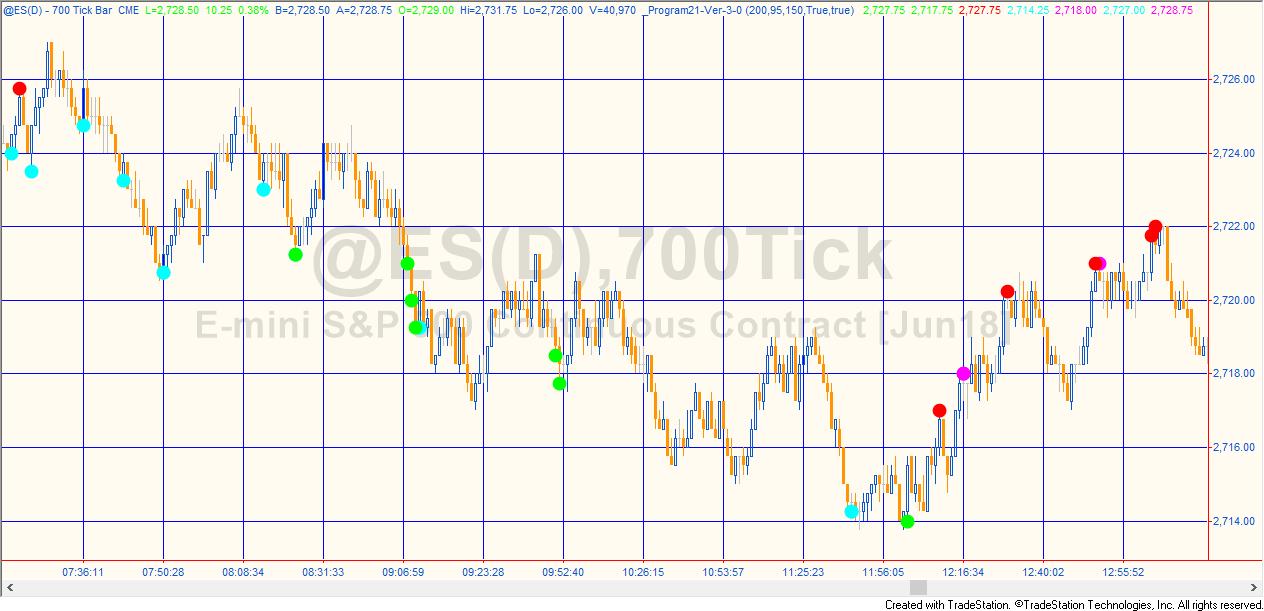
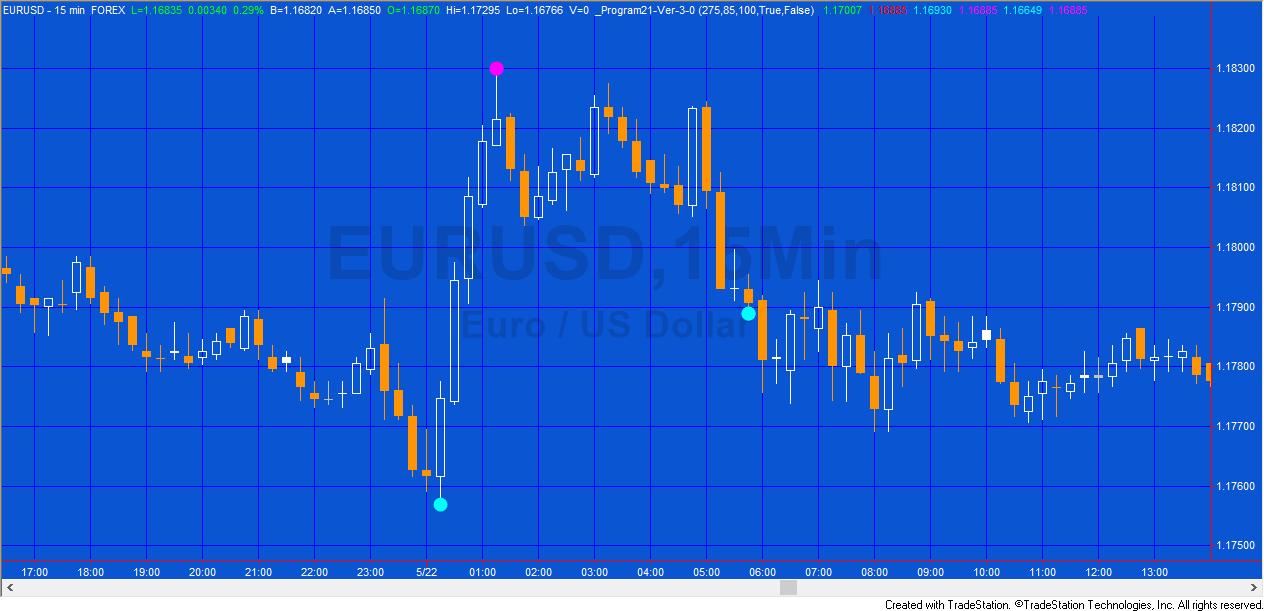
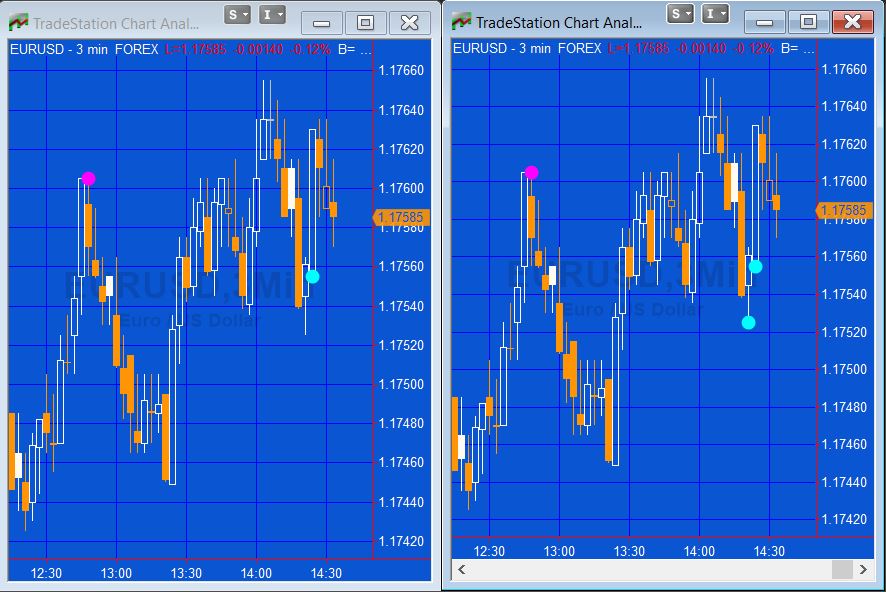
The program works by searching for four distinct chart conditions based on a proprietary combination of the Commodity Channel Index (CCI), stochastics and price momentum. ‘Points’ are drawn on the chart at the specific bar where the conditions become true. Should the condition cease to be true during the formation of a bar, then the ‘point’ is removed UNLESS the _NoPlot input is set to FALSE.
Points are NOT drawn historically (i.e. the program doesn’t recognize a pivot and then plot it retroactively, hence looking good on a chart but having little practical use). More information may be found in the pdf below.
The program functions on minute, tick, seconds and advanced bar types.
I explain the functionality in more detail in the video, lower down the page.
Program 21 Ver. 3.0 video
Original video demonstration of program 21
This video was released with the original program and does not include the new inputs.
The four conditions are plotted as:
- Condition1B
- Condition1T
- Condition2B
- Condition2T
- Condition3B
- Condition3T
- Condition4B
- Condition4T
The ‘B’ refers to bottom points and the ‘T’ refers to top points.

The user has the flexibility to change the appearance of the various conditions by using the Style and the Color tabs within the Format ShowMe window. It is possible to change the colors and styles so that each of the above conditions individually.
For example, you could make Condition1B have a lesser weight than other conditions. Similarly, you could color code conditions in the following dialog.
Inputs
The program has three input settings with default values:
- Adj12( 300 )
- Adj3( 85 )
- Adj34( 100 )
- Alerts( True )
- _NoPlot( True )
As their names imply, Adj12 affects both condition 1 and 2, Adj3 affects condition 3 only and Adj34 affects both condition 3 and 4.
- Adj12 may be set to any positive integer value.
- Adj3 should be set to a value between 0 and 100.
- Adj34 may be set to any positive integer value.
Increasing the values will reduce the number of ‘points’ displayed on the chart. It is up to the user to determine which values produce the most acceptable results.
If Alerts is set to true then an alert occurs each time one of the conditions evaluates to true. The user may control how alerts occur using the format ShowMe study dialog.
With real time bars the conditions associated with turning point plots can change as the bar develops. If _NoPlot is set to TRUE then when a condition changes from TRUE to FALSE the dots are removed from the chart. If _NoPlot is set to FALSE then once a dot is plotted on the chart is is not removed, unless the chart is refreshed.
Download the program 21 user guide PDF here:
Gold Pass area
Program download
The _Program21 Ver. 3.0 show me study is available for IMMEDIATE download for $34.95. The download includes the MultiCharts version. Click the following ‘add to cart’ button.
These TradeStation EasyLanguage programs are fully functional and unprotected, i.e. you can see the source code.
After download the program can be opened, you will be able to see the program code and modify it. After purchase you will be redirected to a download page, so don’t close the browser.
TO THE BEST OF MARKPLEX CORPORATION’S KNOWLEDGE, ALL OF THE INFORMATION ON THIS PAGE IS CORRECT, AND IT IS PROVIDED IN THE HOPE THAT IT WILL BE USEFUL. HOWEVER, MARKPLEX CORPORATION ASSUMES NO LIABILITY FOR ANY DAMAGES, DIRECT OR OTHERWISE, RESULTING FROM THE USE OF THIS INFORMATION AND/OR PROGRAM(S) DESCRIBED, AND NO WARRANTY IS MADE REGARDING ITS ACCURACY OR COMPLETENESS. USE OF THIS INFORMATION AND/OR PROGRAMS DESCRIBED IS AT YOUR OWN RISK.
ANY EASYLANGUAGE OR POWERLANGUAGE TRADING STRATEGIES, SIGNALS, STUDIES, INDICATORS, SHOWME STUDIES, PAINTBAR STUDIES, PROBABILITYMAP STUDIES, ACTIVITYBAR STUDIES, FUNCTIONS (AND PARTS THEREOF) AND ASSOCIATED TECHNIQUES REFERRED TO, INCLUDED IN OR ATTACHED TO THIS TUTORIAL OR PROGRAM DESCRIPTION ARE EXAMPLES ONLY, AND HAVE BEEN INCLUDED SOLELY FOR EDUCATIONAL PURPOSES. MARKPLEX CORPORATION. DOES NOT RECOMMEND THAT YOU USE ANY SUCH TRADING STRATEGIES, SIGNALS, STUDIES, INDICATORS, SHOWME STUDIES, PAINTBAR STUDIES, PROBABILITYMAP STUDIES, ACTIVITYBAR STUDIES, FUNCTIONS (OR ANY PARTS THEREOF) OR TECHNIQUES. THE USE OF ANY SUCH TRADING STRATEGIES, SIGNALS, STUDIES, INDICATORS, SHOWME STUDIES, PAINTBAR STUDIES, PROBABILITYMAP STUDIES, ACTIVITYBAR STUDIES, FUNCTIONS AND TECHNIQUES DOES NOT GUARANTEE THAT YOU WILL MAKE PROFITS, INCREASE PROFITS, OR MINIMIZE LOSSES.
Please email any bugs that you may discover to support@markplex.com.
TO THE BEST OF MARKPLEX CORPORATION’S KNOWLEDGE, ALL OF THE INFORMATION ON THIS PAGE IS CORRECT, AND IT IS PROVIDED IN THE HOPE THAT IT WILL BE USEFUL. HOWEVER, MARKPLEX CORPORATION ASSUMES NO LIABILITY FOR ANY DAMAGES, DIRECT OR OTHERWISE, RESULTING FROM THE USE OF THIS INFORMATION AND/OR PROGRAM(S) DESCRIBED, AND NO WARRANTY IS MADE REGARDING ITS ACCURACY OR COMPLETENESS. USE OF THIS INFORMATION AND/OR PROGRAMS DESCRIBED IS AT YOUR OWN RISK.
ANY EASYLANGUAGE OR POWERLANGUAGE TRADING STRATEGIES, SIGNALS, STUDIES, INDICATORS, SHOWME STUDIES, PAINTBAR STUDIES, PROBABILITYMAP STUDIES, ACTIVITYBAR STUDIES, FUNCTIONS (AND PARTS THEREOF) AND ASSOCIATED TECHNIQUES REFERRED TO, INCLUDED IN OR ATTACHED TO THIS TUTORIAL OR PROGRAM DESCRIPTION ARE EXAMPLES ONLY, AND HAVE BEEN INCLUDED SOLELY FOR EDUCATIONAL PURPOSES. MARKPLEX CORPORATION. DOES NOT RECOMMEND THAT YOU USE ANY SUCH TRADING STRATEGIES, SIGNALS, STUDIES, INDICATORS, SHOWME STUDIES, PAINTBAR STUDIES, PROBABILITYMAP STUDIES, ACTIVITYBAR STUDIES, FUNCTIONS (OR ANY PARTS THEREOF) OR TECHNIQUES. THE USE OF ANY SUCH TRADING STRATEGIES, SIGNALS, STUDIES, INDICATORS, SHOWME STUDIES, PAINTBAR STUDIES, PROBABILITYMAP STUDIES, ACTIVITYBAR STUDIES, FUNCTIONS AND TECHNIQUES DOES NOT GUARANTEE THAT YOU WILL MAKE PROFITS, INCREASE PROFITS, OR MINIMIZE LOSSES.