
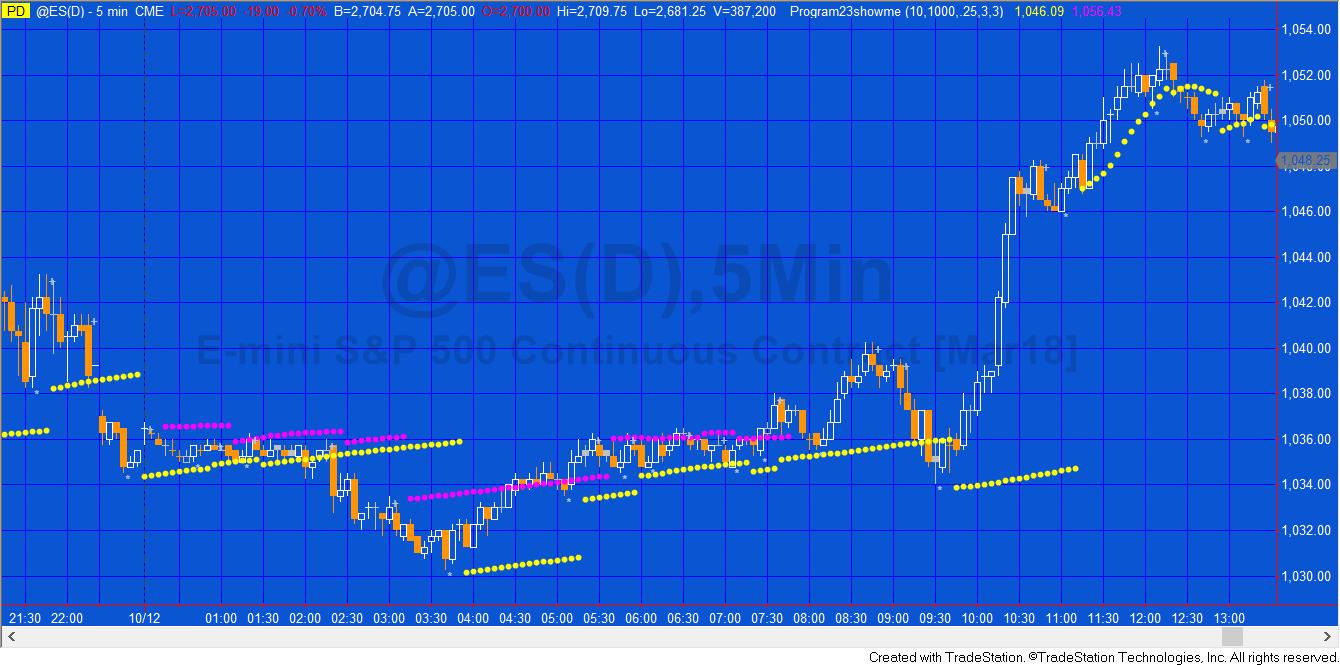
As you study charts it is not uncommon to find places where a moving average of a certain length seems to provide support or resistance to price action. Perhaps because certain technical analysts are using moving averages as a way of finding potential areas of support or resistance.
This TradeStation EasyLanguage showme study seeks to find these moving averages and then it ‘adapts’ its moving average length according to the length of the moving average that was close to the previous high or low pivot.
The program works by, at every new high or low pivot, calculating a range of moving averages (depending on the user inputs). It then compares these moving average values (starting with the slowest, i.e. the moving average with the longest length) and if it finds one within a user defined tolerance of the pivot, it begins plotting a moving average with that length.
In this was it ‘adapts’ the moving average according to the last high or low pivot. The showme study plots both moving averages defined by the high pivots and the low pivot.
The program is a TradeStation EasyLanguage show me study developed in TradeStation 9.0 (and is compatible with later versions) and with MultiCharts. The unprotected source code is included. I have commented out the parts of the program that I used for debugging, however the user might be interested to uncomment these statements to see what they accomplish.
To download the program for a nominal fee click here:
To download the program for a nominal fee click here:
This TradeStation EasyLanguage indicator is demonstrated here:
Video demonstration of program 23
Inputs
Program 23 has four input settings as follows:
- StartMovAvLength( 20 ), // The length of the ‘fastest’ moving average that will be stored in dynamic array
- EndMovAvLength( 200 ), // The length of the ‘slowest’ moving average that will be stored in dynamic array
- Tolerance( 2 ), // How close the moving average has to be to be used as a ‘support’ or ‘resistance’ moving average
- LeftStrength( 3 ), // Number of bars required to the left of a pivot
- RightStrength( 3 ); // Number of bars required to the right of a pivot
To download the program for a nominal fee click here:
The program may be applied to intraday, daily weekly, and monthly charts.
.
TO THE BEST OF MARKPLEX CORPORATION’S KNOWLEDGE, ALL OF THE INFORMATION ON THIS PAGE IS CORRECT, AND IT IS PROVIDED IN THE HOPE THAT IT WILL BE USEFUL. HOWEVER, MARKPLEX CORPORATION ASSUMES NO LIABILITY FOR ANY DAMAGES, DIRECT OR OTHERWISE, RESULTING FROM THE USE OF THIS INFORMATION AND/OR PROGRAM(S) DESCRIBED, AND NO WARRANTY IS MADE REGARDING ITS ACCURACY OR COMPLETENESS. USE OF THIS INFORMATION AND/OR PROGRAMS DESCRIBED IS AT YOUR OWN RISK.
ANY EASYLANGUAGE OR POWERLANGUAGE TRADING STRATEGIES, SIGNALS, STUDIES, INDICATORS, SHOWME STUDIES, PAINTBAR STUDIES, PROBABILITYMAP STUDIES, ACTIVITYBAR STUDIES, FUNCTIONS (AND PARTS THEREOF) AND ASSOCIATED TECHNIQUES REFERRED TO, INCLUDED IN OR ATTACHED TO THIS TUTORIAL OR PROGRAM DESCRIPTION ARE EXAMPLES ONLY, AND HAVE BEEN INCLUDED SOLELY FOR EDUCATIONAL PURPOSES. MARKPLEX CORPORATION. DOES NOT RECOMMEND THAT YOU USE ANY SUCH TRADING STRATEGIES, SIGNALS, STUDIES, INDICATORS, SHOWME STUDIES, PAINTBAR STUDIES, PROBABILITYMAP STUDIES, ACTIVITYBAR STUDIES, FUNCTIONS (OR ANY PARTS THEREOF) OR TECHNIQUES. THE USE OF ANY SUCH TRADING STRATEGIES, SIGNALS, STUDIES, INDICATORS, SHOWME STUDIES, PAINTBAR STUDIES, PROBABILITYMAP STUDIES, ACTIVITYBAR STUDIES, FUNCTIONS AND TECHNIQUES DOES NOT GUARANTEE THAT YOU WILL MAKE PROFITS, INCREASE PROFITS, OR MINIMIZE LOSSES.