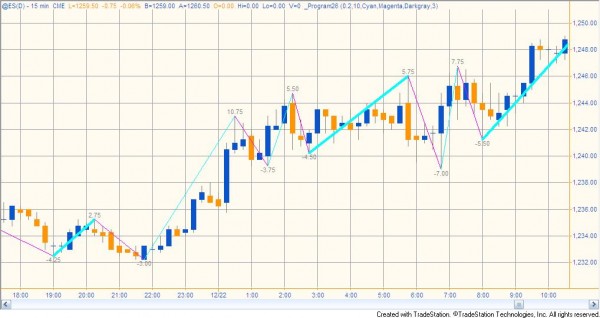
Program 26 applied to a 15 minute @ES chart. The thicker lines mean that the new zig zag is within a user defined tolerance of the previous zig zag line. The numbers show the price change of each zig zag. Negative numbers mean a decrease in price.

Program 26 applied to a 15 minute @ES chart. The thicker lines mean that the new zig zag is within a user defined tolerance of the previous zig zag line. The numbers show the price change of each zig zag. Negative numbers mean a decrease in price.
| Cookie | Duration | Description |
|---|---|---|
| cookielawinfo-checbox-analytics | 11 months | This cookie is set by GDPR Cookie Consent plugin. The cookie is used to store the user consent for the cookies in the category "Analytics". |
| cookielawinfo-checbox-functional | 11 months | The cookie is set by GDPR cookie consent to record the user consent for the cookies in the category "Functional". |
| cookielawinfo-checbox-others | 11 months | This cookie is set by GDPR Cookie Consent plugin. The cookie is used to store the user consent for the cookies in the category "Other. |
| cookielawinfo-checkbox-advertisement | 1 year | The cookie is set by GDPR cookie consent to record the user consent for the cookies in the category "Advertisement". |
| cookielawinfo-checkbox-necessary | 11 months | This cookie is set by GDPR Cookie Consent plugin. The cookies is used to store the user consent for the cookies in the category "Necessary". |
| cookielawinfo-checkbox-performance | 11 months | This cookie is set by GDPR Cookie Consent plugin. The cookie is used to store the user consent for the cookies in the category "Performance". |
| PHPSESSID | session | This cookie is native to PHP applications. The cookie is used to store and identify a users' unique session ID for the purpose of managing user session on the website. The cookie is a session cookies and is deleted when all the browser windows are closed. |
| viewed_cookie_policy | 11 months | The cookie is set by the GDPR Cookie Consent plugin and is used to store whether or not user has consented to the use of cookies. It does not store any personal data. |
| __cfduid | 1 month | The cookie is used by cdn services like CloudFare to identify individual clients behind a shared IP address and apply security settings on a per-client basis. It does not correspond to any user ID in the web application and does not store any personally identifiable information. |
| Cookie | Duration | Description |
|---|---|---|
| YSC | session | This cookies is set by Youtube and is used to track the views of embedded videos. |
| Cookie | Duration | Description |
|---|---|---|
| IDE | 1 year 24 days | Used by Google DoubleClick and stores information about how the user uses the website and any other advertisement before visiting the website. This is used to present users with ads that are relevant to them according to the user profile. |
| test_cookie | 15 minutes | This cookie is set by doubleclick.net. The purpose of the cookie is to determine if the user's browser supports cookies. |
| VISITOR_INFO1_LIVE | 5 months 27 days | This cookie is set by Youtube. Used to track the information of the embedded YouTube videos on a website. |
| Cookie | Duration | Description |
|---|---|---|
| CONSENT | 16 years 8 months 19 days 10 hours | No description |