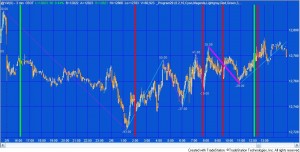
Program 29 is a TradeStation EasyLanguage ShowMe study developed in TradeStation 9.0. It uses historic horizontal zig zag moves (measured in numbers of bars) to attempt to predict future zig zag turning points.

The program uses TradeStation’s new vector class and you may be interested to see how this feature can be useful in this sort of program. The Vector class allows you to create a collection of data elements referenced by an index. Data elements may be inserted, read, and deleted from anywhere within the collection. In this program I insert new elements at the zero position and the index of all the current items after that index are automatically increased by one. I then reduce the size of the vector to make sure it stays within a user input size.
The program may be useful for you if you are interested in working with zig-zag patterns or learning more about the TradeStation vector class.
How the program works
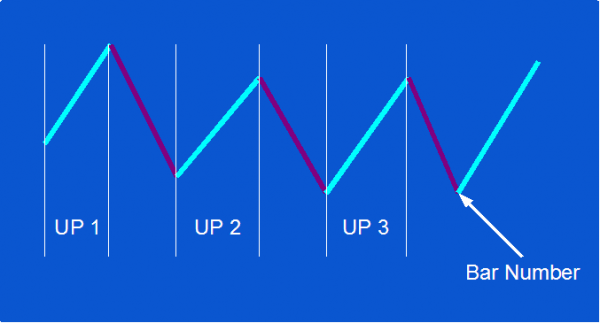
The program works by calculating and storing the length of each horizontal zig zag move, either up or down. In the case of up moves, it then averages the last up moves in terms of the number of bars over which they took place (the number depends on the user input: NumZigZagsInVector , so, for example, if NumZigZagsInVector were set to 1, only the last up move would be used. If it were set to 2 the last two up moves would be averaged. Then, when a new bottom zig zag pivot is confirmed this average is added to the bar number of the bottom zig zag pivot and the result stored in an array of potential bars where potential zig zag bottom pivots may occur.

Similarly for down moves, the program averages the last down moves in terms of the number of bars over which they took place (the number depends on the user input: NumZigZagsInVector , so, for example, if NumZigZagsInVector were set to 1, only the last down move would be used. If it were set to 2 the last two down moves would be averaged. Then, when a new top zig zag pivot is confirmed this average is added to the bar number of the top zig zag pivot and the result stored in an array of potential bars where potential zig zag top pivots may occur.
The size of both the potential top pivots and potential bottom pivots arrays is controlled by the SizeFutureVector user input. For each new bar the program loops through these arrays to see if the bar number if included. If it is a vertical line is drawn. The color of the lines is controlled the TopLine and BottomLine user inputs.
Program 26 functionality
Program 29 includes the functionality created in program 26, i.e. calculates zig-zag patterns and calculates the difference between each high and the next low, and the difference between each low and the next high. The values are ‘drawn’ on the chart to the appropriate number of decimal places. The user can change the color of the zig zag lines and the text. The program also compares each downward zig zag with the previous downward zig zag. If the new downward zig zag is within a user defined tolerance of the previous downward zig zag, the thickness of the current downward zig zag is increased to a user defined value. Similarly, if the new upward zig zag is within a user defined tolerance of the previous upward zig zag, the thickness of the current upward zig zag is increased to a user defined value. This provides a visual cue the ‘matching’ zig zag lengths have occurred.
This UNPROTECTED program (i.e. the TradeStation EasyLanguage show me study) is available for immediate download for $64.95 by clicking the ‘add to cart’ button to pay using Credit card or PayPal. The program is not MultiCharts compatible.
The programs were developed in TradeStation 9.0 and work on intraday, daily, weekly, and monthly charts and works in version 9.9, 9.1, 9.5, 10.0 and higher. The show me study may be applied to tick charts, but the pattern text may not display correctly due to an EasyLanguage drawing tool limitations, particularly for lower tick values.
If you are a Gold Pass member make sure you enter the special coupon code to get 20% discount off this price.
Video demonstration of program 29
User inputs
RetracePerc( 0.2 ), // Percentage above running pivot that pivot must be formed to start a new zig zag
Tolerance( 10 ), // Percentage tolerance calculating a range above and below last change
ZigZagColUp( Cyan ), // Color of up zig zag line
ZigZagColDn( Magenta ), // Color of up zig zag line
ColorOfText( Lightgray ), // Color of number label
TopLine( Red ), // Color of lines projected from top zig zag turning points
BottomLine( Green ), // Color of lines projected from bottom zig zag turning points
LineThickness( 3 ), // Thickness of line if new zig zag is within Tolerance of previous zig zag in same direction and vertical lines
NumZigZagsInVector( 3 ), // The number of zig zags that will be used to average the zig zag move
SizeFutureVector( 30 ); // The maximum number of potential turning points stored in a vector
TO THE BEST OF MARKPLEX CORPORATION’S KNOWLEDGE, ALL OF THE INFORMATION ON THIS PAGE IS CORRECT, AND IT IS PROVIDED IN THE HOPE THAT IT WILL BE USEFUL. HOWEVER, MARKPLEX CORPORATION ASSUMES NO LIABILITY FOR ANY DAMAGES, DIRECT OR OTHERWISE, RESULTING FROM THE USE OF THIS INFORMATION AND/OR PROGRAM(S) DESCRIBED, AND NO WARRANTY IS MADE REGARDING ITS ACCURACY OR COMPLETENESS. USE OF THIS INFORMATION AND/OR PROGRAMS DESCRIBED IS AT YOUR OWN RISK.
ANY EASYLANGUAGE OR POWERLANGUAGE TRADING STRATEGIES, SIGNALS, STUDIES, INDICATORS, SHOWME STUDIES, PAINTBAR STUDIES, PROBABILITYMAP STUDIES, ACTIVITYBAR STUDIES, FUNCTIONS (AND PARTS THEREOF) AND ASSOCIATED TECHNIQUES REFERRED TO, INCLUDED IN OR ATTACHED TO THIS TUTORIAL OR PROGRAM DESCRIPTION ARE EXAMPLES ONLY, AND HAVE BEEN INCLUDED SOLELY FOR EDUCATIONAL PURPOSES. MARKPLEX CORPORATION. DOES NOT RECOMMEND THAT YOU USE ANY SUCH TRADING STRATEGIES, SIGNALS, STUDIES, INDICATORS, SHOWME STUDIES, PAINTBAR STUDIES, PROBABILITYMAP STUDIES, ACTIVITYBAR STUDIES, FUNCTIONS (OR ANY PARTS THEREOF) OR TECHNIQUES. THE USE OF ANY SUCH TRADING STRATEGIES, SIGNALS, STUDIES, INDICATORS, SHOWME STUDIES, PAINTBAR STUDIES, PROBABILITYMAP STUDIES, ACTIVITYBAR STUDIES, FUNCTIONS AND TECHNIQUES DOES NOT GUARANTEE THAT YOU WILL MAKE PROFITS, INCREASE PROFITS, OR MINIMIZE LOSSES.
This UNPROTECTED program (i.e. the TradeStation EasyLanguage show me study) is available for immediate download for $64.95 by clicking the ‘add to cart’ button to pay using Credit card or PayPal.
The programs were developed in TradeStation 9.0 and work on intraday, daily, weekly, and monthly charts. The show me study may be applied to tick charts, but the pattern text may not display correctly due to an EasyLanguage drawing tool limitations, particularly for lower tick values. This program is not compatible with Multicharts.
If you are a Gold Pass member make sure you enter the special coupon code to get 20% discount off this price.

