
Overview
In tutorial 23 I created a tutorial to demonstrate how to add 3-line-break lines to a regular candlestick chart using a TradeStation indicator. Even though TradeStation provides three line break (3LB) charts as part of its standard feature set, tutorial 23 demonstrates techniques that could potentially be used when developing other indicators, show me studies or strategies applied to candlestick or bar charts.
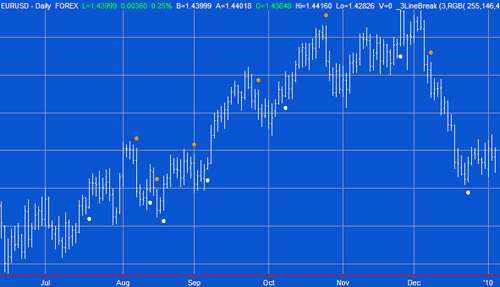
This program takes the core of the program code created in tutorial 23 and applies it to a show me study (see this program applied to a Daily EURUSD chart below). The functionality to draw the ‘quasi’ 3 line break boxes/lines has been removed from the tutorial 23 program and showme dots are drawn at the start of, what would have been the green boxes/lines and what would have been the red boxes/lines on the tutorial 23 indicator.
This program (i.e. the show me study) is available for immediate download for $19.95 by clicking here to pay using a credit card or PayPal.

The program works with versions 8.7 and above, including TradeStation version 10.
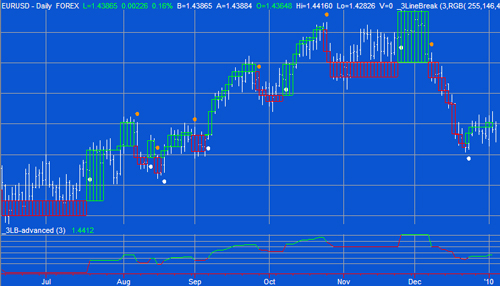
to compare the two programs, the following screen print shows program 3 and tutorial 23 applied to the same chart.
To download the program discussed in tutorial 23 for $29.95 you may go here. The program works with versions 8.7 and above, including TradeStation version 10.
This program (i.e. the show me study) is available for immediate download for $19.95 by clicking here to pay using a credit card or PayPal.
The following video explains the use of the program in more detail. I would also suggest that you view the videos included with tutorial 23 to more fully understand the functionality in this program.
Video demonstration of three line break show-me study
Program inputs
NumBarsBreak( 3 ), The number of bars break (e.g. 3 line break, 4 line break, 5 line break…).
DownCol( Red ), // Color of show me dot. Equivalent to the first ‘red’ bar in a 3 line break chart.
UpCol( Yellow), // Color of show me dot. Equivalent to the first ‘green’ bar in a 3 line break chart.
DispPerc( 20 ); // Percentage distance from low or high of bar based on difference between current high and low displayed on chart. Used to separate the dot from the low or high of the bar.
This program (i.e. the show me study) is available for immediate download for $19.95 by clicking here to pay using a credit card or PayPal. The program works with versions 8.7 and above, including TradeStation version 9.1.
The program is ‘unprotected,’ in other words, you will be able to see the program.
Please email any bugs that you discover to support@markplex.com.