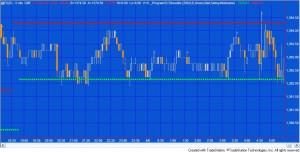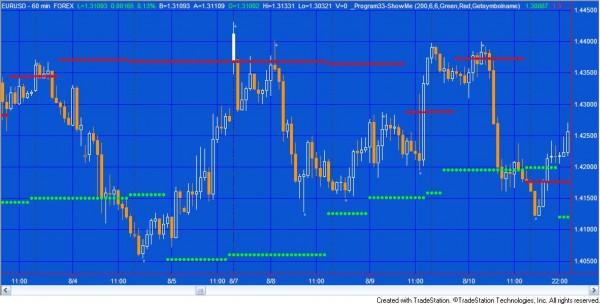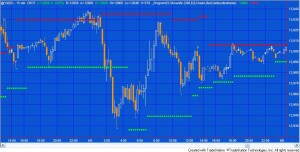
As you study charts it is not uncommon to find places where a moving average of a certain length seems to provide support or resistance to price action. Perhaps certain technical analysts are using moving averages as a way of finding potential areas of support or resistance?
In program 23 I created a TradeStation EasyLanguage showme study that looked for moving averages that were close to a pivot. The program then ‘adapted’ its moving average length according to the length of the moving average that was close to the previous high or low pivot.
This new program (program 33) is similar, except that it does an analysis of daily moving averages and applies them to an intraday chart. Each time a new pivot high or low pivot is confirmed on the intraday chart, the program calculates a range of daily moving averages. It then sees which of these moving averages is closest to the pivot. The program then adapts this moving average to reflect the values of the moving averages closest to the last pivot and plots dots on the chart. This program makes extensive use of Price Series Provider that became available in TradeStation 9.0.
This showme study plots both moving averages defined by the high pivots and the low pivots independently. A user input determines the left and right strength of the pivots.

The program is a TradeStation EasyLanguage show me study developed in TradeStation 9.0. The unprotected source code is included. I have commented out the parts of the program that I used for debugging, however the user might be interested to un-comment these statements to see what they accomplish. The program was designed for intraday charts.

This UNPROTECTED program (i.e. the TradeStation EasyLanguage showme study) DEVELOPED IN VERSION 9.0 is available for immediate download for $94.95 by clicking the ‘add to cart’ button to pay using Credit card or PayPal. Gold Pass members are eligible for 20% off this price when they type in their special discount code (see //markplex.com/gold-pass-content/).
You may find this program useful if you are interested in learning more about Price Series Providers and/or the effect of daily moving averages on an intraday chart.
Video demonstration
User inputs
SizeOfArray( 200), // Size of the array used to store daily moving averages
LeftStrength( 6), // Left strength of high and low pivots
RightStrength( 6), // Right strength of high and low pivots
ClosestLCol( Green ), // Color of dots for moving average determined by the low pivots
ClosestHCol( Red ), // Color of dots for moving average determined by the high pivots
PriceSeries_Symbol ( Getsymbolname ) ; // Symbol to use to calculate daily moving averages (usually the same as the symbol being analyzed)
When a pivot is confirmed the program calculates the latest value of the moving average even if the pivot occurred the previous day.
TO THE BEST OF MARKPLEX CORPORATION’S KNOWLEDGE, ALL OF THE INFORMATION ON THIS PAGE IS CORRECT, AND IT IS PROVIDED IN THE HOPE THAT IT WILL BE USEFUL. HOWEVER, MARKPLEX CORPORATION ASSUMES NO LIABILITY FOR ANY DAMAGES, DIRECT OR OTHERWISE, RESULTING FROM THE USE OF THIS INFORMATION AND/OR PROGRAM(S) DESCRIBED, AND NO WARRANTY IS MADE REGARDING ITS ACCURACY OR COMPLETENESS. USE OF THIS INFORMATION AND/OR PROGRAMS DESCRIBED IS AT YOUR OWN RISK.
ANY EASYLANGUAGE OR POWERLANGUAGE TRADING STRATEGIES, SIGNALS, STUDIES, INDICATORS, SHOWME STUDIES, PAINTBAR STUDIES, PROBABILITYMAP STUDIES, ACTIVITYBAR STUDIES, FUNCTIONS (AND PARTS THEREOF) AND ASSOCIATED TECHNIQUES REFERRED TO, INCLUDED IN OR ATTACHED TO THIS TUTORIAL OR PROGRAM DESCRIPTION ARE EXAMPLES ONLY, AND HAVE BEEN INCLUDED SOLELY FOR EDUCATIONAL PURPOSES. MARKPLEX CORPORATION. DOES NOT RECOMMEND THAT YOU USE ANY SUCH TRADING STRATEGIES, SIGNALS, STUDIES, INDICATORS, SHOWME STUDIES, PAINTBAR STUDIES, PROBABILITYMAP STUDIES, ACTIVITYBAR STUDIES, FUNCTIONS (OR ANY PARTS THEREOF) OR TECHNIQUES. THE USE OF ANY SUCH TRADING STRATEGIES, SIGNALS, STUDIES, INDICATORS, SHOWME STUDIES, PAINTBAR STUDIES, PROBABILITYMAP STUDIES, ACTIVITYBAR STUDIES, FUNCTIONS AND TECHNIQUES DOES NOT GUARANTEE THAT YOU WILL MAKE PROFITS, INCREASE PROFITS, OR MINIMIZE LOSSES.

