
Program 35 (ELCollections version) consists of two programs: _Program35 ADE Sender and _Program35 ADE Receiver. They were designed to allow a user to set levels on one chart by moving horizontal lines with a mouse and for those levels to be, almost, instantaneously available on a second chart. The programs, developed for TradeStation 9.1 and up, were created using EL Collections.
ELCollections and All Data Everywhere (ADE) are user developed programs that, among other things, allow you to transfer data from one chart to another. TradeStation has released a rewrite of the programs that works in multi core environments, i.e. the ‘enable use of multiple CPU cores’ setting can be selected.
ELCollections and All Data Everywhere must be installed in your environment for these programs to work. At the time of the release of this program you can install the new version of EL Collections and ADE by logging into the TradeStation forum and clicking: https://community.tradestation.com/Discussions/Topic.aspx?Result=1&Topic_ID=128732
When you import the ELD, select _Program35 ADE Sender and _Program35 ADE Receiver for import, do not import any associated functions that are included in the ELD.
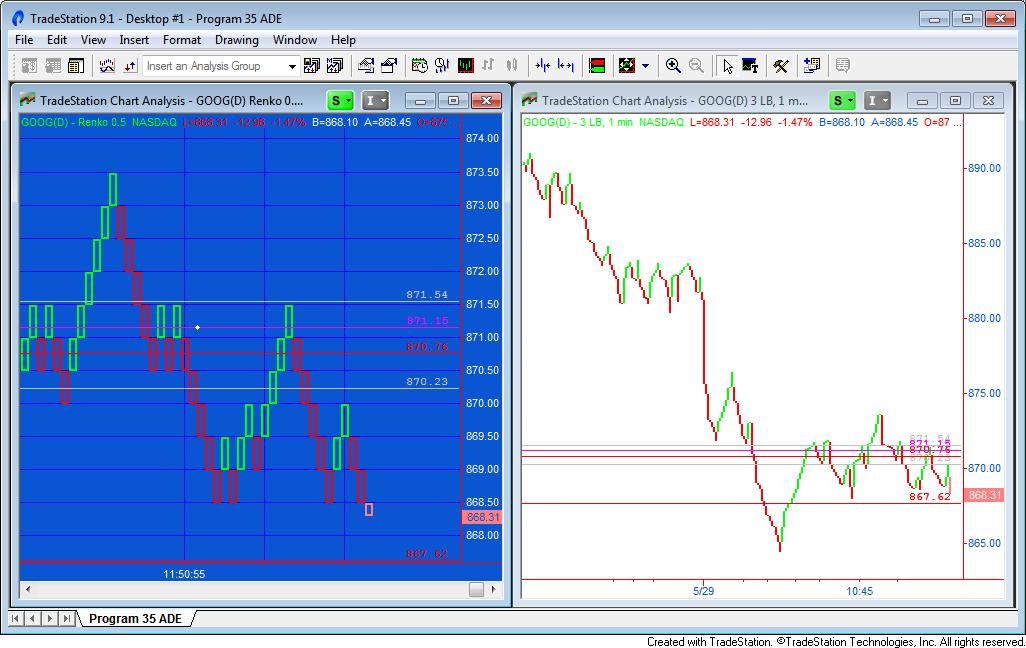
Apply the ‘sending’ indicator to the ‘sending’ chart first. Horizontal lines are drawn evenly spaced vertically throughout the window. The values of the lines are drawn on the right of the lines. The program automatically determines the number of decimal places to show. The lines are colored based on user inputs. The text pertaining to a particular lines is drawn in the same color as the line. Once the sending program has been applied to the sending chart, the receiving program (_Program35 ADE Receiver) can be applied to the receiving chart. Lines are drawn at the same levels as on the sending chart on the receiving chart and the values are drawn towards the right of the chart. It is very important to apply the indicators in this order.
If a line is moved on the sending chart, the corresponding line is also moved on the receiving chart (see the video below for a demonstration).
The idea behind the program is that a user could determine levels or zones on the sending chart using whatever methodology he prefers, and that those same levels would become automatically available on the receiving chart.
Both UNPROTECTED programs (i.e. the TradeStation EasyLanguage sender and receiver indicators) DEVELOPED FOR VERSION 9.1 and higher are available for immediate download for $39.95. Click the ‘add to cart’ button to pay using Credit card or PayPal. Gold Pass members are eligible for 20% off this price when they type in their special discount code (see //markplex.com/gold-pass-content/ to get the latest code).
How the program works
On the sending chart the program calculates the highest and lowest prices visible in the current window. It divides the difference of these two values by the user input NumSR and then draws lines at the lowest value plus multiples of this calculated value to draw NumSR evenly spaced throughout the window. The values of the lines are drawn on the right of the lines.
The horizontal lines are colored based on the user inputs: Color1, Color2, Color3, Color4, Color5, Color6, Color7, Color8, Color9, and Color10. The text pertaining to a particular lines is drawn in the same color as the line.
The sending chart stores levels information and color data in ELCollections lists which are shared between the two charts.
User inputs
_Program35 SenderNew
int NumSR( 5 ), // The number of horizontal lines to draw on chart (maximum = 20 )
int Color1( Red ), // Color of line 1
int Color2( Red ), // Color of line 2
int Color3( Yellow ), // Color of line 3
int Color4( Yellow ), // Color of line 4
int Color5( Magenta ), // Color of line 5
int Color6( Magenta ), // Color of line 6
int Color7( Cyan ), // Color of line 7
int Color8( Cyan ), // Color of line 8
int Color9( Green ), // Color of line 9
int Color10( Green ), // Color of line 10
string UniqueName( “List” ); // Name of EL Collections list. Use the same name on the receiving chart.
_Program35 ReceiverNew
string UniqueName( “List” ); // Name of EL Collections list. Make sure this is the same string as used in the sending chart
Both UNPROTECTED programs (i.e. the TradeStation EasyLanguage sender and receiver indicators) DEVELOPED FOR VERSION 9.1 and higher are available for immediate download for $39.95. Click the ‘add to cart’ button to pay using Credit card or PayPal. Gold Pass members are eligible for 20% off this price when they type in their special discount code (see //markplex.com/gold-pass-content/ to get the latest code).
Video demonstration of program 35 (EL Collections version)
Both UNPROTECTED programs (i.e. the TradeStation EasyLanguage sender and receiver indicators) DEVELOPED FOR VERSION 9.1 and higher are available for immediate download for $39.95. Click the ‘add to cart’ button to pay using Credit card or PayPal. Gold Pass members are eligible for 20% off this price when they type in their special discount code (see //markplex.com/gold-pass-content/ to get the latest code).
TO THE BEST OF MARKPLEX CORPORATION’S KNOWLEDGE, ALL OF THE INFORMATION ON THIS PAGE IS CORRECT, AND IT IS PROVIDED IN THE HOPE THAT IT WILL BE USEFUL. HOWEVER, MARKPLEX CORPORATION ASSUMES NO LIABILITY FOR ANY DAMAGES, DIRECT OR OTHERWISE, RESULTING FROM THE USE OF THIS INFORMATION AND/OR PROGRAM(S) DESCRIBED, AND NO WARRANTY IS MADE REGARDING ITS ACCURACY OR COMPLETENESS. USE OF THIS INFORMATION AND/OR PROGRAMS DESCRIBED IS AT YOUR OWN RISK.
ANY EASYLANGUAGE OR POWERLANGUAGE TRADING STRATEGIES, SIGNALS, STUDIES, INDICATORS, SHOWME STUDIES, PAINTBAR STUDIES, PROBABILITYMAP STUDIES, ACTIVITYBAR STUDIES, FUNCTIONS (AND PARTS THEREOF) AND ASSOCIATED TECHNIQUES REFERRED TO, INCLUDED IN OR ATTACHED TO THIS TUTORIAL OR PROGRAM DESCRIPTION ARE EXAMPLES ONLY, AND HAVE BEEN INCLUDED SOLELY FOR EDUCATIONAL PURPOSES. MARKPLEX CORPORATION. DOES NOT RECOMMEND THAT YOU USE ANY SUCH TRADING STRATEGIES, SIGNALS, STUDIES, INDICATORS, SHOWME STUDIES, PAINTBAR STUDIES, PROBABILITYMAP STUDIES, ACTIVITYBAR STUDIES, FUNCTIONS (OR ANY PARTS THEREOF) OR TECHNIQUES. THE USE OF ANY SUCH TRADING STRATEGIES, SIGNALS, STUDIES, INDICATORS, SHOWME STUDIES, PAINTBAR STUDIES, PROBABILITYMAP STUDIES, ACTIVITYBAR STUDIES, FUNCTIONS AND TECHNIQUES DOES NOT GUARANTEE THAT YOU WILL MAKE PROFITS, INCREASE PROFITS, OR MINIMIZE LOSSES.