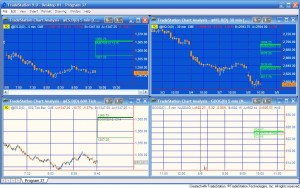
Program 37 shows at which historic price levels gaps have occurred which have not yet been “filled” by price action. It defines gaps as when the open of a new day is different from the close of the previous day, so an up gap would occur when the open of the new day was higher then the previous close. A down gap would occur when the open of the new day was lower then the close of the previous day.
Program 37 can be used with symbols such as @ES.D, @YM.D, equities or custom sessions, where gaps may occur between one daily session and the next. It can be used with intraday and tick charts. The gap information is displayed on the right of the chart as two horizontal lines and a vertical line.
The number of gaps that the program recognizes is determined by a user input (up to a maximum of 100). Once a gap has been filled it is removed from the chart.
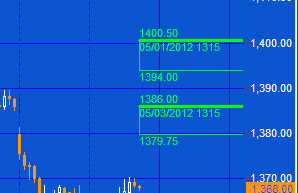
Gaps are displayed as in the following image. The color is determined by the user input: DnGapColor.:

Since these are down gaps, the upper line (representing the close of the previous day) is drawn thicker than the lower line. The value above the upper line is the close and the value below the lower line is the open. The date and time show date and time for the previous day close for the specific gap. I show this in the video. The number of decimal places to display is automatically determined by the program.
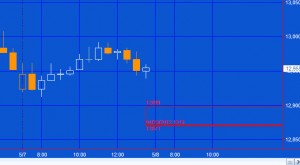
In the following image an up gap has been detected. As before, the thicker line shows the close of the previous day. The color is determined by the user input: UpGapColor.

The UNPROTECTED program (i.e. TradeStation EasyLanguage show me study) DEVELOPED IN VERSION 9.0 of TradeStation is available for immediate download for $49.95. Click the ‘add to cart’ button to pay using Credit card or PayPal. Gold Pass members are eligible for 20% off this price when they type in their special discount code (see //markplex.com/gold-pass-content/ to get the latest code). The download includes the TradeStation ELD and a plain text version. The program is MultiCharts compatible.
User inputs
NumGaps( 5 ), // Up to a maximum of 100
UpGapColor( Red ), // Color of ‘up’ gaps
DnGapColor( Green ) ; // Color of ‘down’ gaps
Video demonstration of program 37
The UNPROTECTED program (i.e. TradeStation EasyLanguage show me study) DEVELOPED IN VERSION 9.0 of TradeStation is available for immediate download for $49.95. Click the ‘add to cart’ button to pay using Credit card or PayPal. Gold Pass members are eligible for 20% off this price when they type in their special discount code (see //markplex.com/gold-pass-content/ to get the latest code). The download includes the TradeStation ELD and a plain text version. The program is MultiCharts compatible.
TO THE BEST OF MARKPLEX CORPORATION’S KNOWLEDGE, ALL OF THE INFORMATION ON THIS PAGE IS CORRECT, AND IT IS PROVIDED IN THE HOPE THAT IT WILL BE USEFUL. HOWEVER, MARKPLEX CORPORATION ASSUMES NO LIABILITY FOR ANY DAMAGES, DIRECT OR OTHERWISE, RESULTING FROM THE USE OF THIS INFORMATION AND/OR PROGRAM(S) DESCRIBED, AND NO WARRANTY IS MADE REGARDING ITS ACCURACY OR COMPLETENESS. USE OF THIS INFORMATION AND/OR PROGRAMS DESCRIBED IS AT YOUR OWN RISK.
ANY EASYLANGUAGE OR POWERLANGUAGE TRADING STRATEGIES, SIGNALS, STUDIES, INDICATORS, SHOWME STUDIES, PAINTBAR STUDIES, PROBABILITYMAP STUDIES, ACTIVITYBAR STUDIES, FUNCTIONS (AND PARTS THEREOF) AND ASSOCIATED TECHNIQUES REFERRED TO, INCLUDED IN OR ATTACHED TO THIS TUTORIAL OR PROGRAM DESCRIPTION ARE EXAMPLES ONLY, AND HAVE BEEN INCLUDED SOLELY FOR EDUCATIONAL PURPOSES. MARKPLEX CORPORATION. DOES NOT RECOMMEND THAT YOU USE ANY SUCH TRADING STRATEGIES, SIGNALS, STUDIES, INDICATORS, SHOWME STUDIES, PAINTBAR STUDIES, PROBABILITYMAP STUDIES, ACTIVITYBAR STUDIES, FUNCTIONS (OR ANY PARTS THEREOF) OR TECHNIQUES. THE USE OF ANY SUCH TRADING STRATEGIES, SIGNALS, STUDIES, INDICATORS, SHOWME STUDIES, PAINTBAR STUDIES, PROBABILITYMAP STUDIES, ACTIVITYBAR STUDIES, FUNCTIONS AND TECHNIQUES DOES NOT GUARANTEE THAT YOU WILL MAKE PROFITS, INCREASE PROFITS, OR MINIMIZE LOSSES.

