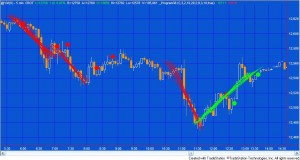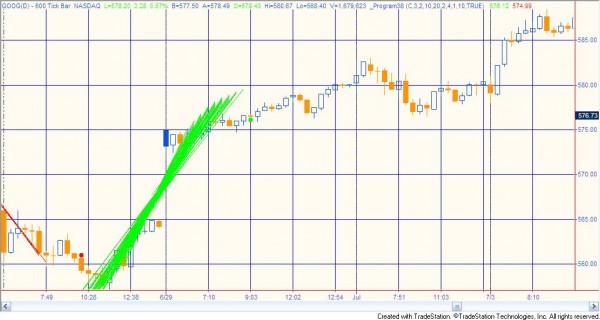
A client asked whether I had created any programs that looked for a trend followed by a ‘pull back.’ The first problem in creating such a program is to determine whether a trend has occurred. This is difficult to achieve and there are many ways of attempting to do it, but in this program (program 38) I calculate a linear regression for several bars. If the slope is steeper than a certain amount and the average of the absolute distance between the potential trend line and the bars over which the calculation is made is less than a certain amount (I call this the ‘trending coefficient’ ), program 38 assumes the line is a trend. To calculate the trending coefficient program 38 calculates the absolute distance of each price point from the calculated trend line. The distances are summed and divided by the number of bars in the potential trend line. A smaller trending coefficient implies that the bars are closer to the trend line.
Program 38 then searched for pivots. If the end of a qualifying trend line occurs within a user defined number of bars of the pivot, and, in the case of an up trend the pivot is lower than the end of the trend line, or, in the case of a down trend the pivot is higher than the end of the trend line, then a ‘dot’ is plotted on the pivot confirming bar indicating a “pull back.”

The UNPROTECTED programs (i.e. TradeStation EasyLanguage show me study and its associated function) DEVELOPED IN VERSION 9.0 of TradeStation are available for immediate download for $89.95. Click the ‘add to cart’ button to pay using Credit card or PayPal. Gold Pass members are eligible for 20% off this price when they type in their special discount code (see //markplex.com/gold-pass-content/ to get the latest code). The download includes:
- TradeStation ELD of the ShowMe study and the function
- A plain text version of the ShowMe study and the function
- A bonus video that explains how to use the Markplex linear regression function included in the download
Program 38 uses a Markplex function which calculates and returns the slope, y-intercept, and trend coefficient, based on the following user inputs:
- StartBar // 0 = Current bar, 1 = one bar ago, 2 = two bars ago etc
- NumBars // How many bars to calculate linear regression over
- Price // Price to calculate trend line for (e.g. Close, Open, High Low )
- MinSlope // The absolute value of all slopes must have greater slope than MinSlope
- MaxCoeff // All slopes must have a MaxCoeff less than this value
- DrawLines // Lines drawn if set to true

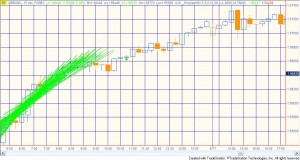
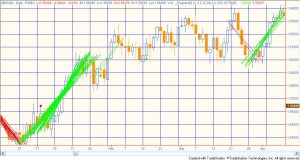
If DrawLines is set to true, the function also draws trend lines on the chart when their absolute slope is greater than the user input passed to the function using MinSlope and the maximum coefficient is less than the user input passed to the function using MaxCoeff .
Program 38 then looks for pivot points or turning points. If it finds a low pivot it then checks whether the end point of an upward sloping trend line has occurred within a user input number of bars. It also checks whether the pivot point is lower than the end point of the line and, if so, it plots a dot at the low of the pivot confirmation bar.
Similarly, if it finds a high pivot it then checks whether the end point of a downward upward sloping trend line has occurred within a user input number of bars. It also checks whether the pivot point is higher than the end point of the line and, if so, it plots a dot at the high of the pivot confirmation bar.
Bear in mind that pivots are confirmed and plotted RightStrength bars after the pivot has occurred.

Program 38 Inputs
- Price( C ), // Price used to calculate trend slope
- LeftStrength( 3 ), // Left strength of pivot after trend line
- RightStrength( 2 ), // Right strength of pivot after trend line
- TrendMin( 10 ), // Trend lines have to be over this number of bars or greater
- TrendMax( 20 ), // Trend lines have to be this number of bars or less
- PullBackMin( 4 ), // When a pivot occurs the trend line end bar must be equal to this number of bars before pivot or greater
- PullBackMax( 9 ), // When a pivot occurs the trend line end bar must be equal to this number of bars before pivot or less
- TrendSlope( 3 ), // Slope of trend line must be greater or equal to this
- MaxCoeff( 10 ), // Slope coefficient must be less than this input
- DrawLines( TRUE ); // Determines if trend lines are drawn
The program uses an array with a maximum size of 50 to store trend information, consequently the difference between TrendMax and TrendMin may be no more than 50. Also, the bigger the TrendMax and TrendMin numbers and the more bars on the chart, the longer the program will take to calculate.
The UNPROTECTED programs (i.e. TradeStation EasyLanguage show me study and its associated function) DEVELOPED IN VERSION 9.0 of TradeStation are available for immediate download for $89.95. Click the ‘add to cart’ button to pay using Credit card or PayPal. Gold Pass members are eligible for 20% off this price when they type in their special discount code (see //markplex.com/gold-pass-content/ to get the latest code). The download includes:
- TradeStation ELD of the ShowMe study and the function
- A plain text version of the ShowMe study and the function
- A bonus video that explains how to use the Markplex linear regression function included in the download
Program 38 Video
The UNPROTECTED programs (i.e. TradeStation EasyLanguage show me study and its associated function) DEVELOPED IN VERSION 9.0 of TradeStation are available for immediate download for $89.95. Click the ‘add to cart’ button to pay using Credit card or PayPal. Gold Pass members are eligible for 20% off this price when they type in their special discount code (see //markplex.com/gold-pass-content/ to get the latest code). The download includes:
- TradeStation ELD of the ShowMe study and the function
- A plain text version of the ShowMe study and the function
- A bonus video that explains how to use the Markplex linear regression function included in the download
How the program works
At the end of each bar the program calculates trend lines for trend line lengths between user inputs: TrendMin and TrendMax bars. If the trend line is sufficiently steep (i.e. with a slope greater or equal to user input TrendSlope) with a slope coefficient less than the user input MaxCoeff then 1 is stored in array for an up trend , -1 is stored in the array for a down trend and 0 is stored if there is no qualifying trend. Qualifying trends are also drawn on the chart.
Each time a new low pivot is found the program looks back between PullBackMin and PullBackMax bars to see if any qualifying up trends ended at one of these bars. If so, and the pivot point is lower than the end of the trend line, a plot is made on the chart. Similarly, each time a new high pivot is found the program looks back between PullBackMin and PullBackMax bars to see if any qualifying down trends occurred at one of these bars. If so, and the pivot point is higher than the end of the trend line, a plot is made on the chart.
TO THE BEST OF MARKPLEX CORPORATION’S KNOWLEDGE, ALL OF THE INFORMATION ON THIS PAGE IS CORRECT, AND IT IS PROVIDED IN THE HOPE THAT IT WILL BE USEFUL. HOWEVER, MARKPLEX CORPORATION ASSUMES NO LIABILITY FOR ANY DAMAGES, DIRECT OR OTHERWISE, RESULTING FROM THE USE OF THIS INFORMATION AND/OR PROGRAM(S) DESCRIBED, AND NO WARRANTY IS MADE REGARDING ITS ACCURACY OR COMPLETENESS. USE OF THIS INFORMATION AND/OR PROGRAMS DESCRIBED IS AT YOUR OWN RISK.
ANY EASYLANGUAGE OR POWERLANGUAGE TRADING STRATEGIES, SIGNALS, STUDIES, INDICATORS, SHOWME STUDIES, PAINTBAR STUDIES, PROBABILITYMAP STUDIES, ACTIVITYBAR STUDIES, FUNCTIONS (AND PARTS THEREOF) AND ASSOCIATED TECHNIQUES REFERRED TO, INCLUDED IN OR ATTACHED TO THIS TUTORIAL OR PROGRAM DESCRIPTION ARE EXAMPLES ONLY, AND HAVE BEEN INCLUDED SOLELY FOR EDUCATIONAL PURPOSES. MARKPLEX CORPORATION. DOES NOT RECOMMEND THAT YOU USE ANY SUCH TRADING STRATEGIES, SIGNALS, STUDIES, INDICATORS, SHOWME STUDIES, PAINTBAR STUDIES, PROBABILITYMAP STUDIES, ACTIVITYBAR STUDIES, FUNCTIONS (OR ANY PARTS THEREOF) OR TECHNIQUES. THE USE OF ANY SUCH TRADING STRATEGIES, SIGNALS, STUDIES, INDICATORS, SHOWME STUDIES, PAINTBAR STUDIES, PROBABILITYMAP STUDIES, ACTIVITYBAR STUDIES, FUNCTIONS AND TECHNIQUES DOES NOT GUARANTEE THAT YOU WILL MAKE PROFITS, INCREASE PROFITS, OR MINIMIZE LOSSES.

