Overview
The program looks for turning points as they occur on a line break chart. Each newly discovered level is compared with levels already stored in an array. If the new level is close enough to an existing level, the two levels are combined. The number of times that each line is combined is also stored in the array. If the new level is not close to an existing level the new level is stored in the array. If the number of times that a line has been combined exceeds a user input value, the line is extended to the right.
More details of the program may be found in the video below.
This unprotected and commented program (i.e. the show me study) is available for immediate download for $49.95 by clicking the ‘add to cart’ button to pay using PayPal or a credit card.
The program works with versions 8.7 and above, including TradeStation version 9.1.
This program combines the functionality developed in tutorial 23 – creating a 3 line break (3LB) indicator to apply to normal candlestick charts and program 3 – three line break show-me study with the pivot confluence idea that is included in program 1, program2 and tutorial 13.
This program also plots the show me ‘dots’ that program 3 plots.
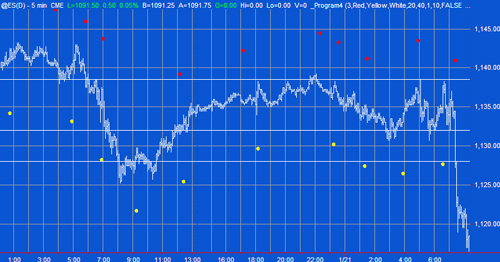
The following chart shows the indicator applied to and @ES chart.

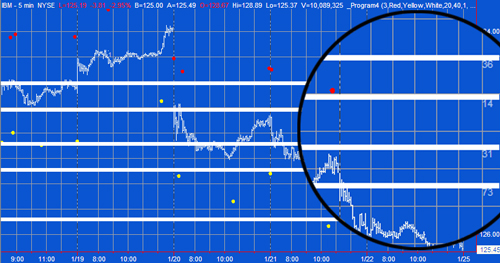
Unlike some of the other pivot confluence programs I have created two options for the display of line thickness (the thicker the line represents how many lines have been combined). The following chart shows the option where lines are actually made thicker. The number represents the number of level lines that have been combined (I crested the magnifier effect in an image editing program):

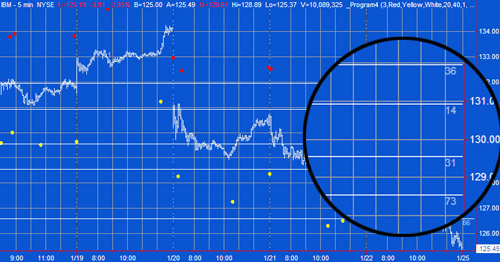
If the ChangeThickness input is set to FALSE, the lines do not get thicker – but they do display a number which represents their thickness.

This unprotected and commented program (i.e. the show me study) is available for immediate download for $49.95 by clicking the ‘add to cart’ button to pay using PayPal or a credit card. The program works with versions 8.7 and above, including TradeStation version 9.1.
The following video explains the use of this program in more detail. I would also suggest that you view the videos included with tutorial 23 and program 2 to more fully understand the functionality in this program.
Video demonstration of three line break pivot confluence show-me study
Program inputs
NumBarsBreak( 3 ), // For a line break chart, how many line-break lines need to be broken to reverse
DownCol( Red ), // Equivalent to the first ‘red’ bar in a 3 line-break chart
UpCol( Yellow), // Equivalent to the first ‘green’ bar in a 3 line-break chart
LineCol( White ), // Color of combined level-lines
DispPerc( 20 ), // Percentage distance from low or high of bar based on difference between current high and low displayed on chart
NumberPivots( 10 ), //Used to set the size of the pivot array. Must be less than 500.
CombineVal( 0 ), // How close do level lines need to be to be combined
LineSensitivity( 0 ), // How many level lines need to be combined before the level line is displayed
ChangeThickness( FALSE ), // If set to TRUE the thickness of lines will change with how many lines are combined
TodaysPivotsOn( TRUE ); // If set to TRUE today’s new level lines are extended to right
N.B. The results that you receive from a program like program 4 really depend on the inputs you provide and the amount of back data you have displayed on your chart. I would suggest that you initially have a year or so of data and a high number for the NumberPivots input. After that, the critical inputs are CombineVal and LineSensitivity. To start with, keep the line sensitivity low and set the CombineVal to be a value that is reasonable for two levels to be combined. For example, for the GBPUSD this might be 0.001, however for the @YM it might be 1. You need to experiment to get results that you find useful.
This unprotected and commented program (i.e. the show me study) is available for immediate download for $49.95 by clicking the ‘add to cart’ button to pay using PayPal or a credit card. The program works with versions 8.7 and above, including TradeStation version 9.1.
The program is ‘unprotected,’ in other words, you will be able to see the program. If you would prefer to pay be check, please make a check payable to Markplex Corporation and mail to 14781 Pomerado Road, #110, Poway CA 92064 together with a valid email address. I will email download instructions to you.
Please email any bugs that you may discover to support@markplex.com.
TO THE BEST OF MARKPLEX CORPORATION’S KNOWLEDGE, ALL OF THE INFORMATION ON THIS PAGE IS CORRECT, AND IT IS PROVIDED IN THE HOPE THAT IT WILL BE USEFUL. HOWEVER, MARKPLEX CORPORATION ASSUMES NO LIABILITY FOR ANY DAMAGES, DIRECT OR OTHERWISE, RESULTING FROM THE USE OF THIS INFORMATION AND/OR PROGRAM(S) DESCRIBED, AND NO WARRANTY IS MADE REGARDING ITS ACCURACY OR COMPLETENESS. USE OF THIS INFORMATION AND/OR PROGRAMS DESCRIBED IS AT YOUR OWN RISK.
ANY EASYLANGUAGE OR POWERLANGUAGE TRADING STRATEGIES, SIGNALS, STUDIES, INDICATORS, SHOWME STUDIES, PAINTBAR STUDIES, PROBABILITYMAP STUDIES, ACTIVITYBAR STUDIES, FUNCTIONS (AND PARTS THEREOF) AND ASSOCIATED TECHNIQUES REFERRED TO, INCLUDED IN OR ATTACHED TO THIS TUTORIAL OR PROGRAM DESCRIPTION ARE EXAMPLES ONLY, AND HAVE BEEN INCLUDED SOLELY FOR EDUCATIONAL PURPOSES. MARKPLEX CORPORATION. DOES NOT RECOMMEND THAT YOU USE ANY SUCH TRADING STRATEGIES, SIGNALS, STUDIES, INDICATORS, SHOWME STUDIES, PAINTBAR STUDIES, PROBABILITYMAP STUDIES, ACTIVITYBAR STUDIES, FUNCTIONS (OR ANY PARTS THEREOF) OR TECHNIQUES. THE USE OF ANY SUCH TRADING STRATEGIES, SIGNALS, STUDIES, INDICATORS, SHOWME STUDIES, PAINTBAR STUDIES, PROBABILITYMAP STUDIES, ACTIVITYBAR STUDIES, FUNCTIONS AND TECHNIQUES DOES NOT GUARANTEE THAT YOU WILL MAKE PROFITS, INCREASE PROFITS, OR MINIMIZE LOSSES.

