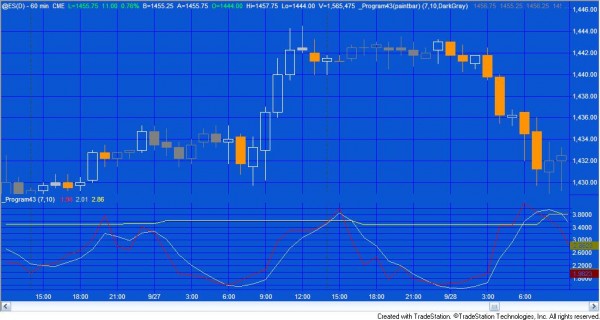
Recently, a client asked whether I had created any programs that helped determine whether an ‘instrument’ was in an area of consolidation or compression or was trending. Obviously this is very difficult to achieve, but that is what program 43, a PaintBar study looks at.
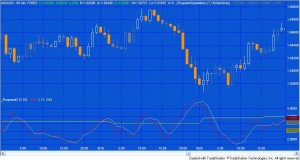
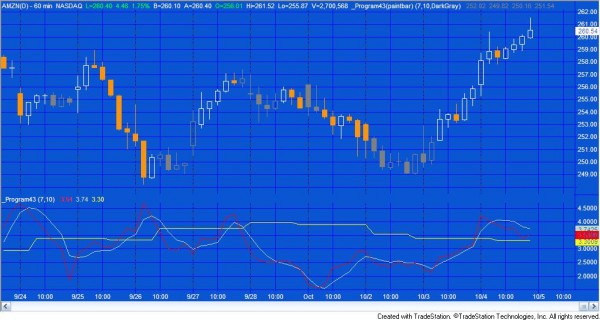
The program works by calculating a compression factor to gain a sense of whether the price might be in a compression zone. It also calculates a triple smoothed version of the compression factor and another calculation that takes compression factor pivot values, stores them in an array, and finds the average of the array. If the current value of the compression factor is less than both the smoothed value and the average of the array, then the corresponding bar on the chart is colored using a paint bar. I explain this in more detail in the video.
I have also included a bonus video for Gold Pass members that explains how pivot values for the compression factor are stored in the array and averaged (see below).
Video demonstration of consolidation finder
Paintbar study user inputs
Length( 7 ), // Length used in compression factor calculation
Smooth( 10 ), // Smoothing factor used in the calculation of triple smoothed Compression Factor
CompressionColor( LightGray ); // Color used to paint bars in compression zones
Indicator user inputs
Length( 7 ), // Length used in compression factor calculation
Smooth( 10 ); // Smoothing factor used in the calculation of triple smoothed Compression Factor

The program is unprotected, commented and fairly easy to understand.
I also include a companion indicator that uses the same algorithms as the paintbar study. You might find it interesting to study the lines to see why bars have been painted using the paintbar study.
The programs were developed in TradeStation 9.0 and work on tick, volume, intraday, daily, weekly, and monthly charts in TradeStation 9.0 and above. Because the programs are unprotected you can open them up and see the program code as well as modify it.
This unprotected and commented programs (i.e. the TradeStation EasyLanguage paintbar study and indicator) are available for immediate download for $39.95 by clicking the ‘add to cart’ button. You can pay with credit card or PayPal.
As usual, Gold Pass members get an additional 20% discount off all program and tutorial prices. If you are a Gold Pass member make sure you enter the special coupon code to get 20% discount off these prices.
This unprotected and commented programs (i.e. the TradeStation EasyLanguage paintbar study and indicator) are available for immediate download for $39.95 by clicking the ‘add to cart’ button. You can pay with credit card or PayPal.
If you are are a Gold Pass member, make sure you are logged in to see the following content:
![]() This content is for members only.
This content is for members only.
Additional screen shots
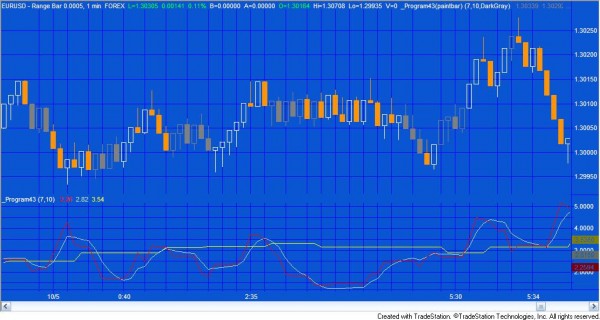
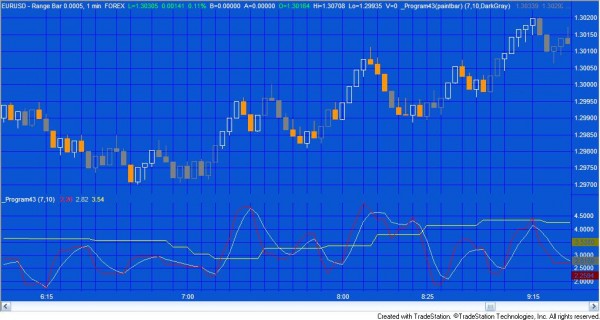
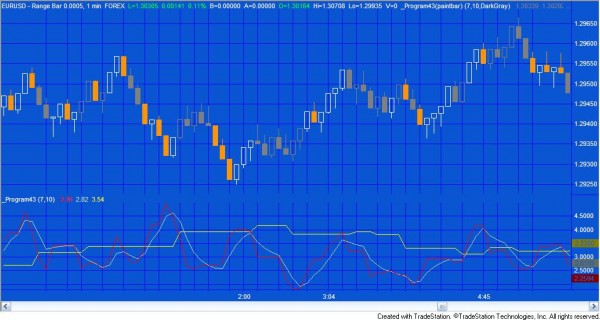
Please note that any screen shots on this site are examples and are not meant to imply that any of these programs will generate profitable trades. THESE INDICATORS, SHOW ME STUDIES, STRATEGIES AND OTHER PROGRAMS HAVE BEEN INCLUDED SOLELY FOR EDUCATIONAL PURPOSES.
TO THE BEST OF MARKPLEX CORPORATION’S KNOWLEDGE, ALL OF THE INFORMATION ON THIS PAGE IS CORRECT, AND IT IS PROVIDED IN THE HOPE THAT IT WILL BE USEFUL. HOWEVER, MARKPLEX CORPORATION ASSUMES NO LIABILITY FOR ANY DAMAGES, DIRECT OR OTHERWISE, RESULTING FROM THE USE OF THIS INFORMATION AND/OR PROGRAM(S) DESCRIBED, AND NO WARRANTY IS MADE REGARDING ITS ACCURACY OR COMPLETENESS. USE OF THIS INFORMATION AND/OR PROGRAMS DESCRIBED IS AT YOUR OWN RISK.
ANY EASYLANGUAGE OR POWERLANGUAGE TRADING STRATEGIES, SIGNALS, STUDIES, INDICATORS, SHOWME STUDIES, PAINTBAR STUDIES, PROBABILITYMAP STUDIES, ACTIVITYBAR STUDIES, FUNCTIONS (AND PARTS THEREOF) AND ASSOCIATED TECHNIQUES REFERRED TO, INCLUDED IN OR ATTACHED TO THIS TUTORIAL OR PROGRAM DESCRIPTION ARE EXAMPLES ONLY, AND HAVE BEEN INCLUDED SOLELY FOR EDUCATIONAL PURPOSES. MARKPLEX CORPORATION. DOES NOT RECOMMEND THAT YOU USE ANY SUCH TRADING STRATEGIES, SIGNALS, STUDIES, INDICATORS, SHOWME STUDIES, PAINTBAR STUDIES, PROBABILITYMAP STUDIES, ACTIVITYBAR STUDIES, FUNCTIONS (OR ANY PARTS THEREOF) OR TECHNIQUES. THE USE OF ANY SUCH TRADING STRATEGIES, SIGNALS, STUDIES, INDICATORS, SHOWME STUDIES, PAINTBAR STUDIES, PROBABILITYMAP STUDIES, ACTIVITYBAR STUDIES, FUNCTIONS AND TECHNIQUES DOES NOT GUARANTEE THAT YOU WILL MAKE PROFITS, INCREASE PROFITS, OR MINIMIZE LOSSES.

